PBC for Claude Code - Rebuild73 vs Rebuild74 Case Study
- Context
- Charts
- What We Observed
- Where The Time Went
- Root Cause
- The Fix
- Mapping to the Research
- Findings by Variable
- Open Questions From This Case
Context
This page is a worked comparison in the same tradition as pbc-4445 and pbc-4849, but it is the case where the assignable cause dissolves once you measure the right thing. Two Darmok scenarios each ran twice against sheep-dog-grammar, on branches Rebuild73 (2026-05-30, ~21:00 EDT) and Rebuild74 (~23:00 EDT). The first scenario was the widest green-phase pair on the 714137558 tab; the second was the next widest. Both looked like a worker doing different amounts of work. Both turned out to be server-side time-to-first-token (TTFT) variance — the model’s actual compute was nearly identical run-to-run, and the visible green-phase spread was almost entirely the client idling, waiting for the API to begin streaming.
| Primary case | Corroborating case | |
|---|---|---|
| Scenario | Test step must have a valid object name validation |
This object doesn't exist validation |
| Rebuild73 commit | 103530e2 |
6ca5963b |
| Rebuild74 commit | 342b5037 |
b52c8014 |
| Green-phase range | 58.4 s (58,417 ms) | 46.8 s (46,824 ms) |
| Files patched | same 5 files | same 5 files |
| Code difference | cosmetic only (see below) | cosmetic only (see below) |
| Diagnosed cause | harness — TTFT/server-wait variance, not spec/prompt/work | same |
The remediation is not a prompt or spec change. There is no defect in either run’s code, and green-verify.md is a generic cross-project template that cannot carry a scenario-specific instruction anyway. The actionable output is a methodology fix: pair-range computed on raw green wall-clock mostly measures TTFT noise; compute an active time from the JSONL (total − idle) and pair-range that instead. Details in The Fix.
Correction. An earlier draft of this page diagnosed the primary case as prompt under-specification — claiming Rebuild74 was slower because it read five extra grammar files to re-derive a validation message the sibling detector already provided. That was wrong on two counts: (1)
green-verify.mdis generic, so the proposed “name the sibling detector as the template” fix had nowhere to live; and (2) once green time is decomposed into active vs idle, Rebuild74’s active time is actually ~2 s lower than Rebuild73’s — the extra reads cost essentially zero wall-clock. The whole 58 s spread is server idle. This rewrite supersedes that draft.
Charts
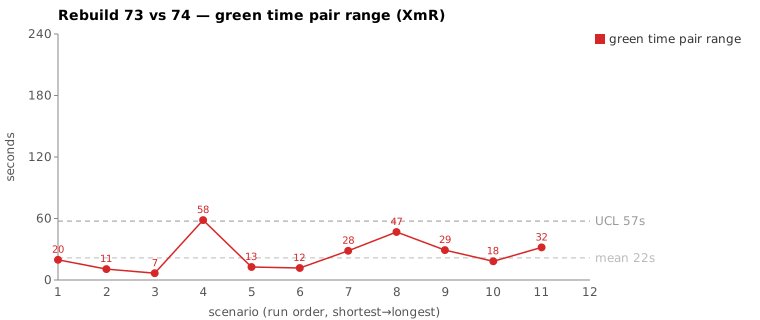
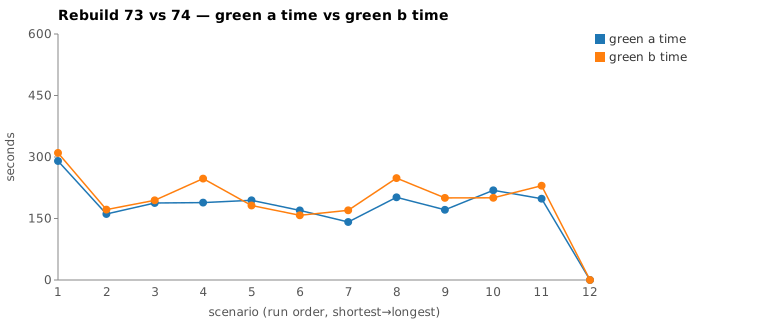
Scenarios are numbered in run order (shortest→longest); see the tables below for which scenario each index is.
What We Observed
Primary case (valid object name):
| Rebuild73 (21:01) | Rebuild74 (22:49) | |
|---|---|---|
| Commit | 103530e2 |
342b5037 |
| Phase total | 403,252 ms | 514,344 ms |
| Red phase | 86,838 ms | 130,380 ms |
| Green phase | 188,879 ms | 247,296 ms |
| Refactor phase | 52,310 ms | 62,729 ms |
Green-phase pair-range = 58,417 ms on a green baseline of ~3 min. The local metrics.csv agreed exactly with the gsheet on both runs. This study scopes to green only.
Green is two claude invocations sharing one --session-id (both --model opus): a green-compile.md pass, then a green-verify.md --resume --effort low pass doing the locate-and-implement work. Both runs passed on the first mvn verify; no timeout, no retry, no silent stall (per-minute output buckets non-zero throughout).
The committed code is functionally identical. The same 5 files change in both runs; TestStepIssueTypes.java is byte-identical; TestStepIssueDetector.java differs only in two logger.debug wordings; ValidateActionImpl.java differs only because each run mirrored a different baseline coding style (+5 vs +10 lines, no semantic difference). The corroborating case shows the same shape — see Two cases, one signature.
Where The Time Went
The breakthrough is decomposing each green session’s wall-clock from the JSONL. Every inter-event interval is one of three kinds:
- idle (TTFT / server-wait) — a
tool_result(or the initial prompt) is logged, then nothing until the next assistant message’s first block appears. The model has not started emitting. This window is queue scheduling + context prefill + network — the client is idle. - tool-exec — an assistant
tool_useblock, then itstool_result. Real work:mvn verify,Read,Edit. - generation — consecutive blocks within one streaming assistant message. Real model output.
active = total − idle = tool + generation. Each window is the phase’s mojo bracket (here, green = green-compile start → /compact start), measuring the claude session’s own work and excluding the inter-phase /compact and trailing maven. This per-phase decomposition comes from .claude/scripts/jsonl-active-time.py; the run-level metrics_<AB>.tsv (all scenarios, active-green ms, drop-in for the gsheet) comes from .claude/scripts/rgr-active-green.py.
| Green session | Total | Idle (TTFT) | Tool | Gen | Active |
|---|---|---|---|---|---|
valid object name R73 |
165.3 s | 116.3 s | 24.8 s | 24.2 s | 49.0 s |
valid object name R74 |
224.8 s | 176.5 s | 23.7 s | 24.6 s | 48.3 s |
object doesn't exist R73 |
178.0 s | 131.8 s | 24.2 s | 22.0 s | 46.3 s |
object doesn't exist R74 |
225.0 s | 173.9 s | 24.0 s | 27.1 s | 51.1 s |
Read the primary-case rows: total differs by +59.5 s, but active differs by −0.7 s (R74 is faster). The entire pair-range lives in idle (116 → 177 s, +60 s). Tool time is a clean control — ~24 s in all four sessions, dominated by the single mvn verify, stable run-to-run as you’d expect for deterministic work. Generation is ~22–27 s everywhere. The only thing that moved is the server-wait.
Anatomy of one idle gap
The clearest single gap in Rebuild74’s primary session, straight from the event stream:
03:18:32.511  tool_result delivered to the API   (previous turn complete)
   … 17.66 s, zero blocks logged …
03:18:50.170  next message's first block (thinking) appears
03:18:52.564  same message's last block — 995 output tokens — done
Once the response started, the whole turn — thinking block, text, two tool calls, 995 tokens — streamed in ~2.4 s. The 17.66 s before it produced nothing. This is the discriminator that rules out “the model thought harder”: extended-thinking tokens stream as they are produced, so a 17 s think would dribble out across the window. Instead the thinking block appeared all at once at the end. The gap is pre-first-token wait, not generation.
Two cases, one signature
Both 73/74 pairs share the identical fingerprint:
valid object name |
object doesn't exist |
|
|---|---|---|
*IssueTypes.java |
byte-identical | byte-identical |
| Detector logic | identical | identical |
| Detector diff | 2 debug-log wordings | debug-log wordings + one null guard |
ValidateActionImpl |
+5 (R73) vs +10 (R74) lines, no semantics | +3 (R73) vs +6 (R74) lines, no semantics |
| Read calls (slow run) | more (13 vs 8) | fewer (11 vs 13) |
| Active time | flat (49.0 vs 48.3 s) | near-flat (46.3 vs 51.1 s) |
| Idle / spread | +60 s | +42 s |
The Read-count column is the tell: in the primary case the slow run read more files, in the corroborating case it read fewer. If exploration depth drove wall-clock, the sign would be consistent. It isn’t. The consistent driver is idle/TTFT. Read count is noise here because reads return in milliseconds and vanish into the ~21 s mvn that dominates tool time.
The cosmetic code differences (debug-log convention, contentEquals vs != null && equals, bare if (isEmpty()) vs full null || isEmpty() + null-coalesce, tabs vs 4-spaces) all trace to baseline style drift between the two rebuild branches — earlier scenarios in each full rebuild left ValidateActionImpl and the sibling detectors in slightly different styles, and each new detector mirrors its own branch. This affects line count, not wall-clock.
Root Cause
Harness — server-side time-to-first-token variance. Across both 73/74 pairs, the model’s active compute (token generation + deterministic tool execution) is essentially constant. What varies, by 42–60 s, is the cumulative time the client spends waiting for the API to begin each streamed response. Decomposed in Where The Time Went and proved at the single-gap level in Anatomy of one idle gap.
TTFT is not purely random — it has a component that scales with context size (prefill of the cached prompt before the first token). Rebuild74’s primary session carried a larger context (~2.56 M cache-read tokens vs ~1.95 M, from its extra reads), so part of its extra idle is self-inflicted prefill. But the corroborating case removes any doubt that work is the driver: there Rebuild74 read fewer files, had near-equal context (~2.69 M vs ~2.54 M cache-read), and still idled +42 s. That residual is server scheduling / load at request time — uncontrollable from the spec, prompt, or worker behavior.
Verified from artifacts: git show on all four commits confirms functionally identical code; the per-event JSONL timeline confirms idle gaps are tool_result → next-assistant windows with zero intervening blocks; the gap-ending messages confirm full content (incl. thinking) streams in 2–3 s once generation starts.
The Fix
There is no prompt or spec change to make. Neither run is wrong, green-verify.md is a generic template, and the variance isn’t work-driven. The fix is to the measurement:
- Pair-range on active time, not raw wall-clock. Add a green-phase active-time column derived from the JSONL:
active = total − Σ idle, where an idle interval istool_result → next new assistant message. A one-pass script over the session file produces it (thetotal / idle / tool / gen / activedecomposition used in the table above). Pair-range on active time would have ranked both these scenarios near zero and not flagged them — correctly, because nothing assignable happened in the worker. - Treat raw-wall-clock pair-range as a noisy pre-filter. It is dominated by TTFT and will keep surfacing server-latency pairs. Use it to nominate candidates, then confirm with active time before writing a case study. A pair that is wide on wall-clock but flat on active time is a server-latency artifact, not a prompt/spec bug.
- Optional, marginal: reduce redundant reads to shrink per-turn context prefill — the only worker-influenceable slice of idle. Worth it for token cost regardless, but it buys only a few seconds of wall-clock and won’t touch the server-load component.
No GH issue is needed for a code fix. If anything is filed, it is a tooling task: “add JSONL active-time decomposition to the rgr-review tooling and pair-range chart so server-TTFT pairs stop masquerading as assignable causes.”
Mapping to the Research
| Predicted symptom (pbc-research) | Observed here |
|---|---|
| Pair-range fires on an assignable cause | Partially refuted — it fired, but the cause was server TTFT, not anything in spec/prompt/work |
| Spec/prompt admits multiple valid paths, all pass | True but irrelevant to the timing — both paths cost the same active time |
| Same-file output is not the disambiguator | Confirmed — near-identical patches, byte-identical types class |
| Cause sites in the producer/prompt, not either run | Refuted for this pair — cause sites in the platform; no producer/prompt fix exists |
| Exploration-depth signal (files read) flags the shape | Refuted — slow run read more in one case, fewer in the other; active time is the honest signal |
This is the counter-example the methodology needed: not every wide pair has a fixable cause. pbc-6970 found a real active-time difference (one blocking Explore subagent call); this page found a wide pair with no active-time difference. The two are only distinguishable by computing active time — which is the upgrade this case motivates.
Findings by Variable
Each subsection records this run’s findings about one Wheeler variable. Read the same heading across the run sequence to see how our understanding of that variable evolved.
green time pair range
A wide wall-clock pair-range here was not a vague test — it over-reported. The 58 s primary green spread decomposed to a −0.7 s active-time difference (R74 actually faster); the entire range lived in server idle, not in any work or spec ambiguity. Treating raw-wall-clock pair-range as a noisy pre-filter, then confirming with active time, re-ranked the board: recomputing on active time collapsed both wall-clock-widest pairs to near-zero and promoted a different scenario (Test step must have a valid step definition name validation) as the real outlier on active time.
green time pair range moving range
No finding this run.
green time
No finding this run.
green time moving range
No finding this run.
scale & green tokens
This is one of the two canonical server-noise cases (with pbc-7980): the wide wall-clock pair-range dissolved once active time was computed — the two runs did near-identical work, and the spread was almost entirely server time-to-first-token (TTFT) and decode noise rather than tokens generated. Idle was 70–79 % of total green time in all four sessions; once a response started, a full turn (incl. a 995-token thinking block) streamed in ~2–3 s. TTFT has a context-prefill component that scales with cache-read token count (R74’s primary session carried ~2.56 M vs ~1.95 M), but the corroborating case (fewer reads, near-equal context, still +42 s idle) shows server scheduling / time-of-day load dominates. This is the case that motivated normalizing for the per-token rate.
warm-up position
No finding this run.
Open Questions From This Case
- How much of idle is context-prefill vs pure server scheduling? Prefill scales with cache-read token count; a controlled run holding the worker’s read set fixed while varying nothing else would isolate the server-load component. The corroborating case (fewer reads, equal context, still +42 s idle) suggests scheduling dominates, but it isn’t quantified.
- Should
--effort lowongreen-verify.mdchange TTFT? Effort affects thinking budget, which is generation, not TTFT — so it should not. Worth confirming it doesn’t accidentally inflate prefill. - Re-ranking the tab by active time changes the answer. Recomputing all 11 tracked scenarios’ green time as active-ms (
metrics_7374.tsv, produced by.claude/scripts/rgr-active-green.py 73 74) collapses both wall-clock-widest pairs to near-zero active range (valid object name58,417 → 654 ms;object doesn't exist46,824 → 4,857 ms) and promotes a different scenario —Test step must have a valid step definition name validation— from a 12,687 ms wall-clock range to a 30,896 ms active range, the widest on the active board. That pair has a genuine work difference the wall-clock idle was masking, and is the one that actually warrants a divergence walk. A follow-up case should run that scenario down.