PBC for Claude Code - Rebuild75 vs Rebuild76 Case Study
- Context
- Charts
- Case A —
This object doesn't exist validation(common cause) - Case B —
Test suite name should start with a capital letter validation(assignable: prompt gap) - Mapping to the Research
- Findings by Variable
- Open Questions From This Case
Context
This page is a worked comparison in the same tradition as pbc-4445, pbc-4849, and pbc-6970. Two Darmok scenarios from the same consecutive-run pair ran against sheep-dog-grammar on branches Rebuild75 (early-morning EDT) and Rebuild76 (afternoon EDT). Both showed a wide green-phase pair-range, and inspecting them together is instructive precisely because they land on opposite sides of the classification gate:
- Case A —
This object doesn't exist validation(green range 88.7 s): the two runs produced functionally identical code via a single passing build each; the gap is per-request server overhead plus run-to-run nondeterminism in how thoroughly the worker pre-verified before running the build. Common cause — no scenario fix. One general prompt-framing amplifier (the build was framed as a closing “regression” rather than the oracle) was correctness-neutral enough to apply anyway. - Case B —
Test suite name should start with a capital letter validation(green range 47.3 s): the two runs also produced identical code, but here the slower run burned ~3.5 minutes hunting dependency jars and~/.m2to decide whether a spec-defined class already existed before creating it — after it had already concluded the classes must be created. The green prompts never told the worker that spec’d classes are created, not found. Assignable — fixed in the prompts, and the fix belongs upstream in green-compile because the two phases share one Claude session.
The pair is a clean illustration that “widest pair-range” is a trigger, not a diagnosis: the same two runs, on the same day, yield one common-cause result and one assignable-cause result. The discipline is in telling them apart (the Deming/Wheeler point — and see pbc-7374 for why wall-clock ranking surfaces both signal and noise).
| Case A | Case B | |
|---|---|---|
| Scenario | This object doesn't exist validation |
Test suite name should start with a capital letter validation |
| Rebuild75 commit | fa7f8a3 |
06fae34 |
| Rebuild76 commit | 08da47b |
291328e |
| Green-phase range | 88.7 s (88,657 ms) | 47.3 s (47,250 ms) |
| Resulting code | functionally identical (5 files) | functionally identical (10 files, incl. 2 new classes) |
| Verdict | common cause — no scenario fix | assignable — green prompt gap |
| Action | measurement-level follow-ups; build-as-oracle reframe applied (correctness-neutral) | applied: green-compile reads uml-package + interaction specs before the log; green-verify Rule 1 now covers Bash + states spec’d ⇒ create |
Charts
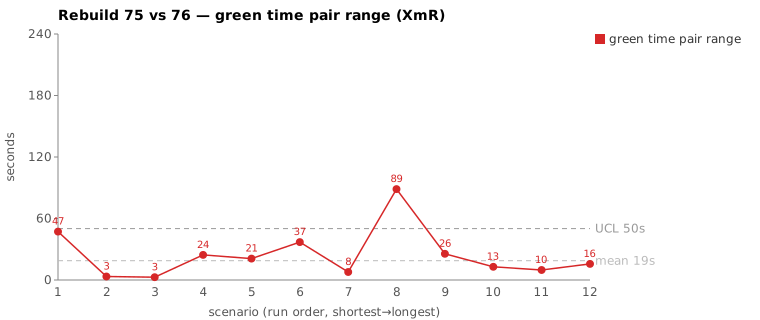
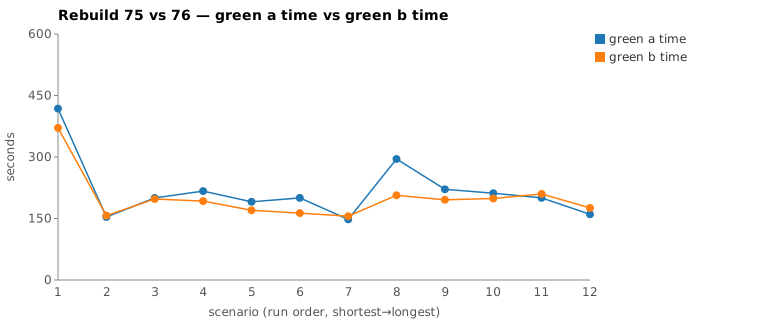
Scenarios are numbered in run order (shortest→longest); see the tables below for which scenario each index is.
Case A — This object doesn't exist validation (common cause)
What We Observed
The study scopes to the green phase only. Red and refactor are reported for context but not analyzed.
| Rebuild75 (02:14 EDT) | Rebuild76 (13:54 EDT) | |
|---|---|---|
| Commit | fa7f8a3 |
08da47b |
| Phase total | 8:17 (497,898 ms) | 6:28 (388,049 ms) |
| Red phase | 1:00 (60,039 ms) | 1:16 (76,475 ms) |
| Green phase | 4:55 (295,234 ms) | 3:26 (206,577 ms) |
| Refactor phase | 1:06 (66,147 ms) | 0:56 (56,172 ms) |
Both green phases split into two claude calls against one shared session id: a short green-compile (--print … green-compile.md) that checks log.txt for compilation errors and exits if there are none, then a green-verify (--resume … --effort low … green-verify.md) that reads the JaCoCo shortlist, implements the change, and runs mvn verify. The mojo-log brackets give the sub-segment split:
| Green sub-segment | Rebuild75 | Rebuild76 | Δ |
|---|---|---|---|
green-compile (Running → Writing jacoco-shortlist) |
33.6 s | 27.5 s | 6.1 s |
green-verify (Writing jacoco-shortlist → Completed) |
240.7 s | 157.5 s | 83.2 s |
| green total (mojo bracket) | 274.4 s | 185.0 s | 89.4 s |
The entire spread lives in green-verify. green-compile differs by 6 s and is uninteresting.
Where The Time Went
Measured over each session’s green window (compile + verify), from the per-session JSONL:
| Metric | Rebuild75 | Rebuild76 | Note |
|---|---|---|---|
| green wall-clock | 274.4 s | 185.0 s | +89.4 s on R75 |
| assistant turns | 63 | 47 | +16 on R75 |
| tool calls | 41 | 30 | +11 on R75 |
| thinking blocks | 2 | 2 | identical |
| text blocks | 20 | 15 | |
| output tokens | 7,996 | 5,424 | |
| cache-read tokens | 3,781,476 | 2,387,093 | scales with turn count |
| Read calls (verify) | ~21 | 9 | R75 read 2.3× more files |
| Grep calls (verify) | 6 | 8 | R76 substituted greps |
| Edit calls (verify) | 4 | 4 | identical |
mvn verify cycles |
1 | 1 | both passed first try |
| stop reasons | all clean (end_turn / tool continuations) |
all clean | no stall, no retry, no hang |
The shape of the difference is entirely in navigation: R75 made 11 more tool calls, almost all of them whole-file Reads — including reading SheepDogBuilder.java three times and reading EMFTestObject.java, TestConfig.java, StepObjectRefFragments.java, ITestProject.java, and uml-interaction-test.md that it never edited. R76 reached the same understanding with targeted Greps (interface ITestProject, Workspace, removeStepObjectWithFullName) and read 9 files. Both then made the same four edits and ran one mvn verify that passed.
The 21 vs 9 Read calls (the divergence)
Both sessions open identically through green-compile and into the start of green-verify: ToolSearch → seed TodoWrite → Grep log.txt for errors → read jacoco-shortlist.md → read the .feature → read the three issue-detector source files → read ValidateActionImpl.java → read uml-interaction-main.md. The trajectories split at the point where each worker decides how to locate the supporting types it needs to wire the new validation in:
| # | Rebuild75 (Read-heavy) | Rebuild76 (Grep-heavy) |
|---|---|---|
| split | Read uml-interaction-test.md |
Grep getTestDocumentList\|getTestDocument |
Read SheepDogUtility.java |
Grep interface ITestProject (×2) |
|
Read StepObjectRefFragments.java |
Grep Workspace (×3) |
|
Grep getTestDocument (×2) |
Grep isAbsent\|Absent |
|
Glob **/ITestProject.java |
Read InputFileAsciidocFileImpl.java |
|
Read ITestProject.java |
Grep removeStepObjectWithFullName |
|
Read SheepDogBuilder.java |
→ 4 Edits | |
Grep setAbsent\|removeStepObject |
||
Read EMFTestObject.java |
||
→ 3 Edits, then Read InputFileAsciidocFileImpl.java ×2, Read TestConfig.java, Read SheepDogBuilder.java ×2, 1 more Edit |
R75 spent roughly 240 s in verify; R76 roughly 157 s. The ~83 s difference decomposes approximately as:
- ~30 s uncontrollable server overhead — 11 extra tool calls means ~11 extra request round-trips, each carrying TTFT (queue + context prefill of a growing transcript) at an observed ~2.7 s/request (pbc-7374 / the idle-extraction work). This is the same TTFT noise that ranks the pair high in the first place.
- ~53 s redundant pre-run verification — the extra whole-file reads (e.g.
SheepDogBuilder.javathree times) are work, but work that produced no additional edit and changed nothing about the result.
What the thinking transcripts show (the real axis)
The Read-vs-Grep count is a symptom; the cause is visible in the narration. Both runs reached the same implementation plan at the same point — R75 at 06:16:12, R76 at 17:55:44 — both reading uml-interaction-main.md, finding the cascade pattern at “line 96–112”, and concluding the same three edits (enum description, new validateStepObjectNameWorkspace, wire it into ValidateActionImpl after validateStepDefinitionNameOnly). Through making the edits the trajectories are equivalent.
They split on whether to trust the build or pre-simulate the fixture:
- R76 (run-as-oracle): made the edits, ran
mvn verifyimmediately, let it pass. It never asked whether the fixture would drive the new branch. - R75 (simulate-then-run): after the same edits, it spent ~40 s convincing itself the test would pass before running it, narrated verbatim — “I need to check if the scenario’s Given step actually creates the stepdef document… let me check if
InputFileAsciidocFileImpl.setCreatedcreates the stepdef document” (06:17:40); “But wait — the scenario doesn’t call setCreated…setAbsentcallsremoveStepObjectWithFullName… if none existed, it’s a no-op” (06:18:02); “I need to check whatcreateTestProjectdoes withfileExtension” (06:18:06); “SofileExtension = .asciidoc… the lookup will fail and return the error. The src/test change is already done. Let me run verify.” (06:18:21).
The SheepDogBuilder.java re-read was not redundant in the model’s view — it returned for a different sub-question (first: how getTestDocument matches by full name, to design the lookup; second: what fileExtension createTestProject sets, to predict whether the computed .asciidoc path would match). The second visit only existed because R75 chose to predict the outcome instead of running the build that would have told it in one shot — which is exactly what R76 did.
This is still common cause (the prompt mandates neither behavior and both pass), but it names a controllable axis: pre-run verification depth.
Classification
Verdict: common cause. No assignable cause is present.
Evidence, work-proxy by work-proxy:
| Proxy | R75 | R76 | Equivalent? |
|---|---|---|---|
| Files edited | TestStepIssueTypes, TestStepIssueDetector, ValidateActionImpl |
same | ✅ |
| Edit count | 4 | 4 | ✅ |
mvn verify cycles |
1 (passed) | 1 (passed) | ✅ |
| Resulting code | validateStepObjectNameWorkspace added + wired |
same method, same wiring, same enum string | ✅ functionally identical |
| Stalls / retries / timeouts | none | none | ✅ |
| Tool calls | 41 | 30 | ❌ R75 +11, all redundant Reads |
The two commits patch the same five files. The three source patches are functionally identical: both add a validateStepObjectNameWorkspace(ITestStep) to TestStepIssueDetector that resolves the step’s full name via SheepDogUtility, walks the ancestor ITestProject’s getTestDocumentList(), and sets TEST_STEP_STEP_OBJECT_NAME_WORKSPACE (“The step object file doesn’t exist for the component”) when no document matches; both wire it into ValidateActionImpl immediately after validateStepDefinitionNameOnly. The only differences are cosmetic — R75 uses .stream().anyMatch(...) where R76 uses a for-loop with break, and R75 logs getStepObjectName() where R76 logs getFullName(). No behavioral difference, no test difference.
So the gap is not “one run did more or wrong work because an instruction was unclear.” Both runs followed the green-verify prompt as written (“read the shortlist and listed files, implement per the UML specs, run mvn verify”) and converged on the same code on the first build. The divergence is the route taken to that code, and the cost of the route is per-request overhead plus redundant reads. That is common-cause variation by definition: it is inside the system’s normal behavior, it has no single removable cause, and the next run could land anywhere on the same spread for reasons that have nothing to do with this scenario.
The Fix, or Why No Fix
No scenario-level fix is warranted, and proposing one would be tampering.
The tempting “fix” is to edit green-verify.md to bias the worker toward Grep over Read, since R76’s grep-first route was faster. That would be reacting to one sample’s lucky path. It does not generalize (whole-file reads are correct and necessary in plenty of scenarios), it would not reliably remove the per-request overhead component, and it treats common-cause noise as if it were a defect — the textbook tampering failure mode. The honest output of this investigation is that the system behaved normally on both runs.
The legitimate follow-ups are at the measurement level, not the scenario level:
- Chart active time, not wall-clock. The pair-range sheet should rank on idle-stripped active time per pbc-7374 and the idle-extraction work, so pairs like this — wide on wall-clock, near-equal on work — stop rising to the top and consuming investigation budget.
- Apply SPC limits to the selection. Rather than always inspecting the single widest pair, treat the per-scenario series as an individuals/moving-range (XmR) chart and only investigate points outside 3σ. A pair inside the limits is common cause by construction and should be left alone. (Both follow-ups are tracked as the open active-time / moving-range discussions; no scenario GH issue is appropriate here.)
One candidate system change — since applied
There is a third option that is not tampering, but it must be reasoned about carefully. Tampering is reacting to a single common-cause point by adjusting the process to chase that point. Working on the system to reduce common-cause variation across all scenarios is the opposite — it is the legitimate, encouraged activity (Deming: “work on the system”), provided the change is driven by a general mechanism, not fitted to one pair.
The divergence walk surfaced such a mechanism. The green-verify prompt’s process step 4 read: “Run mvn verify as a regression and fix any issues.” Framing the build as a closing regression check — after fully implementing main and test — invites the worker to treat the build as a confirmation of an already-believed-correct change, which licenses the predict-then-build simulation R75 fell into. The mechanism is general (any scenario can fall into it) and the fix cannot hurt correctness (the build is the real oracle regardless), so it was applied: step 4 now reads “Run mvn verify -Dtest=${runnerClassName} to verify the fix for the failing test first. Do NOT trace the test fixture or reason about whether the test will pass before running it; run the build first and let the result decide,” with the full regression moved to a new step 5. This both reframes the build as the oracle and scopes the first build to the one failing test for a faster signal.
The honest caveat remains N = 1 for the variance claim: that this narrows the simulate-vs-run spread across scenarios is still to be confirmed by re-running a handful after the edit. But the change stands on its own as a correctness-neutral clarification regardless of the variance evidence, which is why applying it is not tampering — it is not chasing the one pair’s timing, it is removing a license the prompt should never have granted.
Case B — Test suite name should start with a capital letter validation (assignable: prompt gap)
This scenario is the first one processed in each run, and it requires creating two new source classes (TestSuiteIssueDetector, TestSuiteIssueTypes) plus impls and Guice bindings — 10 files in total. It is intrinsically slower than Case A on both runs (~6 min green each vs ~3–4 min), which gives any divergence more absolute room. But unlike Case A, the divergence here traces to a concrete, removable instruction gap.
What We Observed
| Rebuild75 | Rebuild76 | |
|---|---|---|
| Commit | 06fae34 |
291328e |
| Phase total | 12:11 (731,336 ms) | 9:20 (560,499 ms) |
| Red phase | 1:02 (62,106 ms) | 1:04 (64,781 ms) |
| Green phase | 6:58 (418,107 ms) | 6:10 (370,857 ms) |
| Refactor phase | 2:56 (176,179 ms) | 1:00 (60,830 ms) |
Green sub-segments (mojo brackets):
| Green sub-segment | Rebuild75 | Rebuild76 |
|---|---|---|
| green-compile | 33.9 s | 109.3 s |
| green-verify | 363.5 s | 239.8 s |
| green total | 397.5 s | 349.0 s |
Both commits create the same 10 files with near-identical line counts — including the two new src/main classes — so, as in Case A, the output is functionally identical. The green range is 47.3 s, and it is partly masked by an offset: R76 front-loaded implementation work into its (cold-Maven, first-scenario) green-compile call (109 s), while R75 did it all in green-verify. The signal lives in green-verify, where R75 spent 124 s longer on one thing.
The 3.5-minute jar hunt (the divergence)
R75’s green-verify contains a ~2-minute silent gap (the per-minute token bucket skips 05:26 and 05:27; the helper’s >300 s gap detector missed it at 124 s). The narration shows R75 had already reached the correct answer, then talked itself out of it:
- 05:24:22 — “No
ValidateActionImpl, noTestSuiteIssueDetector, noTestSuiteIssueTypes— all need to be created.” ✓ correct - 05:24:35 — “These must be in a dependency jar.” ← second-guess
- 05:25:25 — “They’re mentioned in
uml-interaction-main.mdas patterns…” (the spec was telling it to create them) - then a jar/
.m2sweep, ending 05:28:01 — “The IssueDetector/IssueTypes don’t exist anywhere — they’re new classes this scenario needs.” (re-confirmed the negative it already knew)
The hunt was a sequence of Bash commands run between step 1 (read) and step 2 (implement) — before writing a single line:
jar tf target/sheep-dog-grammar-1.59-SNAPSHOT.jar | grep -i "IssueDetector|IssueTypes"
grep -r "TestSuiteIssueTypes|TestSuiteIssueDetector" target/dependency/
mvn dependency:build-classpath -q | tr ':' '\n'
find ~/.m2/repository/org/farhan -name "*.jar" -newer pom.xml | while read j; do jar tf "$j" | grep -l "TestSuiteIssue"; done
jar tf target/sheep-dog-grammar-1.59-SNAPSHOT.jar | grep -i "ITestSuite|ITestDocument|ITestProject"
jar tf target/sheep-dog-grammar-1.59-SNAPSHOT.jar | grep "Issue"
find /home/farhan/.m2 -name "*.jar" -path "*/org/farhan/*" | while read j; do jar tf "$j" | grep -q "IssueDetector|IssueTypes"; done   # ← ~2 min, 05:25:58 → 05:28:01
The final find ~/.m2 … | while read j; do jar tf "$j" … scanned every org.farhan jar in the local Maven repository and unpacked each one’s table of contents — ~2 minutes to confirm a class is absent that the model had already decided to create. R76 asked the same “do these exist yet?” question but answered it with cheap in-project Glob/ls and never touched ~/.m2.
Root Cause
This is assignable to the green prompts, and the line between this and Case A is exactly what makes the classification gate useful:
- Case A’s divergence (pre-run fixture simulation) has no instruction that could resolve it — the build is always the only true oracle, and you cannot tell the model a-priori “the test will pass.” So it is irreducible common cause.
- Case B’s divergence is resolvable by an instruction. The behavior is not irrational — in this ecosystem some classes legitimately do arrive from dependency jars, so checking is reasonable in the abstract. But neither green prompt told the worker the decision rule for create-vs-dependency. The
site/uml/specs (uml-class-TypeIssueDetector.md,uml-class-TypeIssueTypes.md,uml-package.md, and the{Type}IssueDetectorpattern inuml-interaction-main.md) describe exactly the classes this project creates — so a missing class that appears in the spec should be created, full stop. With that rule in context, R75 never enters the jar hunt. Without it, the ambiguity is real and the worker is free to spend minutes resolving it however it samples.
The shared session is the key to where the fix belongs. green-compile and green-verify are the same Claude session (green-verify --resumes green-compile’s session id), so whatever green-compile reads is still in context when green-verify reaches step 2. At runtime, R75’s green-compile ran the old prompt — it grepped the failure log and exited without reading any spec — so green-verify began cold, with no model of “what this project creates,” and the jar-hunt instinct fired the moment it saw missing classes. The repair therefore lives upstream, in reading order: if green-compile reads uml-package.md (the list of classes this project creates) and the interaction specs before it greps the log, the shared session carries that knowledge into green-verify, and a missing spec’d class is recognized as create-it rather than find-it.
A second, complementary gap enabled the expense: File IO Rule 1 prohibited Read/Grep/Glob outside ${projectPath}, but R75 escaped it with Bash (find ~/.m2, jar tf, grep -r target/dependency). The rule had a Bash-shaped hole — it named three tools and the worker used a fourth.
The Fix — applied
Two complementary changes, both since committed to the darmok-maven-plugin prompts.
1. Reorder green-compile to read the spec before the log (leverages the shared session). green-compile now reads ${umlDir}/uml-package.md (the list of classes this project creates) and the interaction specs as its first steps, then greps the failure log. Because the session is shared, green-verify inherits the “what we create” model and no longer needs to discover it cold. The effect is to establish, before any failure is even seen, that the spec is the authority on what exists in the codebase.
green-compile Process (new order):
1. Read `${umlDir}/uml-package.md` — the list of classes you'd create in this project.
2. Read `${umlDir}/uml-interaction-main.md` and `uml-interaction-test.md` — implementation examples.
3. Grep `${logPath}` for COMPILATION ERROR|… ; do NOT read the full file.
4. If COMPILATION ERROR: stub + loop `mvn verify -Dtest=${runnerClassName}`.
5. Otherwise exit immediately.
2. Close the Bash hole in green-verify File IO Rule 1. The rule now forbids inspecting anything outside ${projectPath} — including dependency jars and ~/.m2 — via Bash (find/jar tf/grep/ls) as well as Read/Grep/Glob, and states the decision rule explicitly: a class named in uml-package.md or the interaction specs is one this project creates; if it’s missing, create it under the allowlist, do not hunt for it in a jar even if a class of the same name exists there.
Unlike Case A’s reframing, this fix rests on a determinable mechanism (the prompts omitted a decision rule the spec already encodes) and is not chasing one sample’s luck — the spec-first rule is correct for every scenario that creates a spec-defined class. The N = 1 caveat applies only to the magnitude of variance reduction, not to the correctness of the rule.
Mapping to the Research
| pbc-research prediction | What we observed |
|---|---|
| Pair-range flags “look here”, not “something is broken” | Confirmed twice over — the same run pair produced one common-cause result (Case A) and one assignable result (Case B). The flag is triage, not diagnosis. |
| Same-artifact does not imply same-path | Confirmed in both cases — identical output, divergent paths (Case A: navigation; Case B: a 3.5-min jar hunt one run skipped). |
| Wall-clock fuses work with server overhead | Confirmed — Case A’s gap is ~30 s server overhead; Case B’s is a single ~124 s Bash detour, recoverable only by reading the transcript, not the timing. |
| Assignable cause appears on first or second pass | Held for Case B (jar-hunt → prompt gap, found first pass); did not hold for Case A (no assignable cause — the first “common cause, no action” verdict in the series). Both outcomes are legitimate. |
Findings by Variable
Each subsection records this run’s findings about one Wheeler variable. Read the same heading across the run sequence to see how our understanding of that variable evolved.
green time pair range
Two pairs, both wide, both landing on identical code via one passing build each — but on opposite sides of the gate. Case A’s 88.7 s green range is a clean common-cause case: the two runs followed the same green-verify prompt and converged on functionally identical code (the only differences are cosmetic — .stream().anyMatch vs a for/break loop, getStepObjectName() vs getFullName() in a log line), so the spread is not “one run did wrong work because an instruction was unclear.” The range is wide because it fuses per-request server overhead with run-to-run nondeterminism in pre-run verification depth — how thoroughly the worker pre-simulated the fixture before trusting the build. That route variation is inside the system’s normal behavior with no single removable cause, so the verdict is common cause and no scenario fix is warranted; biasing the prompt toward the lucky faster route would be tampering.
green time pair range moving range
No finding this run.
green time
The first-scenario create-two-classes Case B is intrinsically the longest of the pair — ~6 min green on each run versus ~3–4 min for Case A — because it creates 10 files including two new src/main classes plus impls and Guice bindings. That larger absolute green time gives any divergence more absolute room to open up, which is part of why its 47.3 s range reads large even though the output is again functionally identical across the two runs.
green time moving range
No finding this run.
scale & green tokens
Case A’s ~83 s green-verify spread decomposes into roughly ~30 s of uncontrollable per-request server overhead — 11 extra tool calls means ~11 extra request round-trips, each carrying TTFT (queue + growing-transcript prefill) at an observed ~2.7 s/request — plus ~53 s of redundant whole-file reads that produced no additional edit. The overhead component scales with turn count (R75: 63 turns / 41 tool calls / 7,996 output tokens / 3.78M cache-read; R76: 47 / 30 / 5,424 / 2.39M), so the cache-read volume tracks navigation depth rather than work done. One confound on the server-overhead reading: the two runs ran at different times of day (R75 early-morning EDT, R76 afternoon EDT), so the per-request rate is not measured under identical server load. The legitimate follow-up is measurement-level — chart idle-stripped active time and apply XmR limits so wall-clock-wide / work-equal pairs like this stop consuming investigation budget.
warm-up position
Case B is the first scenario processed in each run — the one that founds the framework — and its assignable signal is a warm-up artifact. R75’s green-verify burned ~3.5 minutes (a ~2-minute silent find ~/.m2 / jar tf sweep) hunting dependency jars to decide whether spec-defined classes already existed, after it had already concluded they must be created. As the first scenario, green-compile ran cold with no model of “what this project creates,” so the jar-hunt instinct fired the moment it saw missing classes. Assignable — fixed in the prompts: green-compile now reads uml-package.md + the interaction specs before it greps the failure log (the shared session then carries the “spec’d ⇒ create” model into green-verify), and File IO Rule 1 now closes the Bash hole (find/jar tf/grep/ls outside ${projectPath} are forbidden, not just Read/Grep/Glob). The first-scenario cold-Maven tax (R76’s 109 s green-compile) is a separate, possibly larger warm-up lever worth its own look.
Open Questions From This Case
- How many top-of-sheet pairs are common cause? If re-ranking on active time demotes this pair (and others like it), the methodology’s hit rate on assignable causes should rise. A quick audit of the last ~10 widest wall-clock pairs against their work proxies would quantify how much investigation budget wall-clock ranking is currently wasting.
- Is “redundant whole-file Read” a cheap detectable signal? R75 read
SheepDogBuilder.javathree times and read several files it never edited. A “files read but not edited” or “same file read N times” counter might be a lightweight proxy for exploration-overhead without needing full active-time accounting — though note that even when detectable, it is still common cause and not something to fix. - Where is the active-time / XmR work anchored? Both measurement-level follow-ups depend on the idle definition and the SPC framing being settled; neither has a GH issue yet. They should get one before the sheet’s ranking column is changed.
- Did the Case B fix actually narrow the spread? The green-compile reorder + Rule-1 Bash extension are applied; the next run pair should be checked for the
find ~/.m2/jar tfpattern’s absence and a tighter green-verify spread on create-new-class scenarios. The rule is correct regardless, but its leverage is still unmeasured. The cold-Maven first-scenario tax (R76’s 109 s green-compile) is a separate, possibly larger lever worth its own look.