PBC for Claude Code - Rebuild83 In-Run Pairs Case Study
- Context
- Charts
- The token-scaled pair-range
- Pair 1 —
62c1749c: rate jitter (common cause) - Pair 2 —
0f4deff8: a small work-volume difference (common cause via the walk) - Pair 3 —
6db846b9: flagged beyond threshold → common cause plus a silent stall - Root cause across the three
- The Fix
- Mapping to the Research
- Findings by Variable
- Open Questions From This Case
Context
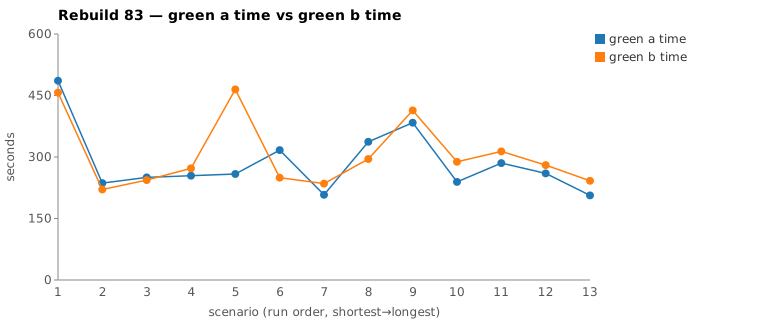
This page is a batch-level companion to the single-pair studies pbc-4445, pbc-4849, and pbc-6768. It differs from them in two ways. First, the pair is now in-run: since issue #434 every Darmok scenario runs its green phase twice — worktree _a and worktree _b, both branched from the same red commit, sequentially minutes apart — and keeps the shorter. The pair-range is |green_a − green_b| from a single metrics row, not two runs hours apart on different model-of-the-day and a different red commit. Second, rather than deep-diving one pair, it reviews three scenarios from one batch (Rebuild83), each of which lands in a different regime of a new gate we built while doing it: the token-scaled pair-range.
All three resolve to common cause. The value here is not a fix — there are none to make — it is the methodology that told us so, and why each pair varied:
| Scenario | Commit | Green _a |
Green _b |
Range | Token diff | Regime → verdict |
|---|---|---|---|---|---|---|
| Header row Cell names should start with a capital letter validation | 62c1749c |
5:16 | 4:09 | 1:07 | 3% | within / small scaled range → rate jitter, common |
| This object doesn’t exist validation | 0f4deff8 |
5:37 | 4:55 | 0:42 | 11% | within / large scaled range → small work-volume diff, walk → common |
| Test step must have a valid step definition name validation | 6db846b9 |
4:18 | 7:44 | 3:26 | 62% | beyond threshold → flagged → walk → common + a silent stall (#417) |
(Bold = the winning half that was brought back and refactored.)
The in-run pair removes the confounds the cross-run pairs fused in — same red commit, same model-of-the-day, same server window — so a wide range now points more squarely at work vs generation rate. The token-scaled gate makes that split explicit.
Charts
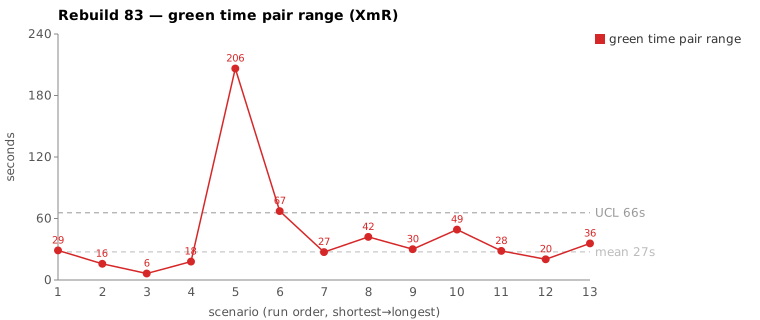
Scenarios are numbered in run order (shortest→longest); see the tables below for which scenario each index is.
The token-scaled pair-range
Wall-clock fuses two things we must not conflate: real work (closely tracked by output tokens generated) and the per-token generation rate (server load, queue, context-prefill jitter — uncontrollable). The gate works in two numbers, both read off the green-phase JSONL of each half:
- Token similarity. If the two halves’ green output tokens are within a threshold (
TOKEN_SIMILARITY_THRESHOLD, default 15%), they did near-equivalent work; beyond it, one half generated materially more — a real work difference. - The scaled range. When within threshold, scale the slower half to the faster half’s per-token rate:
scaled_slow = (fast_seconds / fast_tokens) × slow_tokens. The scaled range (|scaled_slow − fast|) is the work-attributable part of the gap; the rate overhead (raw_slow − scaled_slow) is generation-rate jitter — server-side, not recoverable by any input change.
That yields three regimes, and Rebuild83 produced one clean example of each:
- Within threshold, small scaled range → the range is rate jitter. Common cause.
- Within threshold, large scaled range → a small work-volume difference at equal rate; the divergence walk decides whether it’s nondeterministic verbosity (common) or one half exploring a real spec ambiguity (assignable).
- Beyond threshold → the halves did materially different work; don’t scale, walk it, and ask whether the test case drove the difference (assignable) or the model simply over-deliberated (common).
This replaces eyeballing “how much was waste.” Earlier in the series we estimated the recoverable portion of a range by reading per-minute token buckets; the scaled range computes it.
Pair 1 — 62c1749c: rate jitter (common cause)
_a (loser) |
_b (winner) |
|
|---|---|---|
| Green wall-clock | 5:16 | 4:09 |
| Green output tokens | 6,676 | 6,891 |
| Tool calls | 37 | 35 |
mvn verify cycles |
2 | 2 |
| Edit / Write | 2 / 2 | 2 / 2 |
Token similarity 3% (within threshold); raw range 67s. Scaling _a to _b’s rate gives 242s (raw 317s) — a scaled range of 8s and 75s of rate overhead. So almost the entire 67s gap is generation-rate jitter, not work: at equal rate the two halves are within 8 seconds.
The shape confirms it. _a carried one near-zero minute — 04:16 = 65 output tokens, a ~68s stretch between two Reads where generation slowed without stalling — which is exactly the kind of per-request slowness the rate overhead captures. Identical tool work (2 mvn cycles, 2 edits, same outcome), within 3% on tokens, and the gap dissolves under scaling. Common cause — no fix.
Pair 2 — 0f4deff8: a small work-volume difference (common cause via the walk)
_a (loser) |
_b (winner) |
|
|---|---|---|
| Green wall-clock | 5:37 | 4:55 |
| Green output tokens | 7,549 | 6,706 |
| Tool calls | 41 | 41 |
mvn verify cycles |
2 | 2 |
| Read / Grep | 13 / 11 | 16 / 8 |
Token similarity 11% (within threshold) — but here scaling tells a different story than Pair 1: scaled _a is 332s (raw 337s), a scaled range of 37s with only 5s of rate overhead. The per-token rate was essentially identical; the 42s gap is work volume — _a generated ~12% more content.
That is the regime the gate’s buckets originally didn’t cover (a within-threshold pair whose scaled range is large), so the case sent it to the divergence walk. The walk is decisive: tool work is identical — 41 calls, 2 mvn cycles, 4 edits, same five-file outcome — and the only difference is exploration style: _a grep-heavier (11 vs 8), _b read-heavier (16 vs 13), with _a reasoning ~12% more, spread diffusely (every minute non-zero, no stall). This is the Read-heavy-vs-Grep-heavy nondeterminism pbc-6768 named — ordinary model-of-the-moment variation, not a spec ambiguity one half had to resolve. Common cause. (It also drove the skill refinement: “within threshold but large scaled range” now routes explicitly to the divergence walk.)
Pair 3 — 6db846b9: flagged beyond threshold → common cause plus a silent stall
_a (winner) |
_b (loser) |
|
|---|---|---|
| Green wall-clock | 4:18 | 7:44 |
| Green output tokens | 6,809 | 17,714 |
| Tool calls | 32 | 35 |
mvn verify cycles |
2 | 2 |
| Edit | 4 | 3 |
This is the widest pair on the batch (3:26), and the only one the gate flagged: token similarity 62%, far beyond threshold, so the section refuses to scale and routes to the walk. The flag was earned — _b generated 2.6× the tokens for the same tool work (32 vs 35 calls, 2 vs 2 mvn cycles, comparable edits, identical outcome; _a won and was kept).
The walk resolves the flag two ways, neither a test-case fix:
- A silent stall.
_b’s per-minute token bucket shows04:03 = 0and04:05 = 16— two near-dead minutes inside ~104s and ~81s gaps betweenReads, with the prior turn endingstop_reason = tool_use. That’s ~2 minutes the model sat silent, not working. The old fixed-threshold (>300s) gap detector missed both (sub-threshold); the per-minute token bucket caught them. This is exactly the signal issue #417 proposes a watchdog for, and the case is now referenced there — with the refinement that the watchdog should trip on zero output tokens for N seconds whilestop_reason = tool_use, not a fixed inter-tool-call gap. - Over-deliberation, not a spec ambiguity. The remaining gap is
_bgenerating 2.6× the tokens while running the same tool actions and reaching the same commit — the same “re-derive a fact the inputs already settled” over-thinking pbc-6768 documented, not one half forced down a longer path by an under-specified test.
So even the widest, flagged pair is common cause — with one recoverable slice (the ~2-minute stall, a detection gap, not a spec defect). The flag did its job: it made us look harder, and looking confirmed there is nothing in the test case to fix.
Root cause across the three
There is no spec gap, no prompt defect, and no producer/consumer mismatch in any of the three. Run the same checklist pbc-6768 used and every box comes back clean. What remains is common-cause variation in three flavors the gate cleanly separates: per-token rate jitter (62c1749c), a small nondeterministic difference in generation volume / exploration style (0f4deff8), and over-deliberation plus a silent stall (6db846b9). The only recoverable item across all three is the 6db846b9 stall — and that is a detection improvement (#417), not a change to the scenario.
In Wheeler/Deming terms this is the regime pbc-6768 entered and Rebuild83 confirms: the assignable-cause hunt has dried up. Investigating points inside the limits now is tampering. The honest read of three common-cause pairs is “the system is in control” — and the gate that says so without manufacturing a phantom fix is the deliverable.
The Fix
None at the scenario level — proposing one would be tampering. Two legitimate, system-level follow-ups, neither a per-pair patch:
- Silent-stall detection (#417). The only recoverable time in the batch was
6db846b9’s ~2-minute stall. A JSONL watchdog that kills-and-resumes on zero output tokens for N seconds (with the laststop_reason = tool_use) would have reclaimed it ~1–2 minutes earlier. The per-minute token bucket is the reliable signal; a fixed gap threshold is not (it missed both stalls here), so the fixed detector was removed from the review tooling in favor of it. - The standing common-cause levers from pbc-6768 —
--effortcontrol (#426) and smaller scenarios — remain the way to lower the band itself, distributionally, rather than chasing any one pair.
Mapping to the Research
| Predicted (pbc-research) | Observed across the three |
|---|---|
| Wide pair-range fires the signal | yes — 0:42 to 3:26 |
| Each run individually in-control | yes — every half a typical green for its scenario |
| Both halves pass the test | yes — all six |
| Two work-trees differ | no — same outcome each pair; the variance is in deliberation/rate, not code |
Like pbc-4849 and pbc-6768, all three are pure-path cases — same output, the variance entirely in how the worker got there. The new element is quantifying that: the token-scaled range puts a number on how much of each gap was work vs rate, and the threshold tells assignable-candidate from equivalent-work before the walk even starts.
Findings by Variable
Each subsection records this run’s findings about one Wheeler variable. Read the same heading across the run sequence to see how our understanding of that variable evolved.
green time pair range
All three in-run pairs (range 0:42 to 3:26) resolved to common cause: same red commit and same outcome each pair, so the variance was in deliberation and generation rate, not divergent code. The in-run pair removes the confounds the cross-run pairs fused in, so a wide range now points squarely at work-volume versus generation-rate jitter. A flagged or large-scaled-range pair is an invitation to walk it, not a verdict — 6db846b9 tripped the token threshold and still resolved to common cause (over-deliberation plus a silent stall) on the walk.
green time pair range moving range
No finding this run.
green time
No finding this run.
green time moving range
No finding this run.
scale & green tokens
This run derived the token-scaled pair-range gate: token similarity (default 15% threshold) decides whether the two halves did near-equivalent work, and for within-threshold pairs the slower half is scaled to the faster half’s per-token rate so the scaled range isolates work-attributable time from server-side rate overhead. This replaced eyeballing “how much was waste” with a computed number and produced three clean regimes in one batch — rate jitter (62c1749c, 3%), a small work-volume difference at equal rate (0f4deff8, 11%), and beyond-threshold materially different generation volume (6db846b9, 62%). The per-minute output-token bucket also beat a fixed gap threshold for detecting silent stalls, catching 6db846b9’s two sub-300s zero-token minutes the old detector missed (#417).
warm-up position
No finding this run.
Open Questions From This Case
- Is 15% the right token-similarity threshold? Rebuild83 separated cleanly (3%, 11%, 62%), so anything in 10–30% would have classified these three identically. A batch with a pair near the boundary would calibrate it.
- Within-threshold-but-large-scaled-range — how often is it assignable rather than nondeterministic style?
0f4deff8was style (Read vs Grep). A future case where the extra generation traces to one half resolving a genuine spec ambiguity would be the assignable instance of this regime, and worth pinning. - Does the scaled range track the green-phase spread as
--effort(#426) is tuned? If lower effort narrows the rate-overhead component without raising the green-verify failure rate, that is the distributional win pbc-6768 set up — and the scaled range is the metric to read it on.