PBC for Claude Code - Rebuild77 vs Rebuild78 Case Study
- Context
- Charts
- What We Observed
- Where The Time Went
- Classification
- The Fix, or Why No Fix
- Mapping to the Research
- Findings by Variable
- Open Questions From This Case
Context
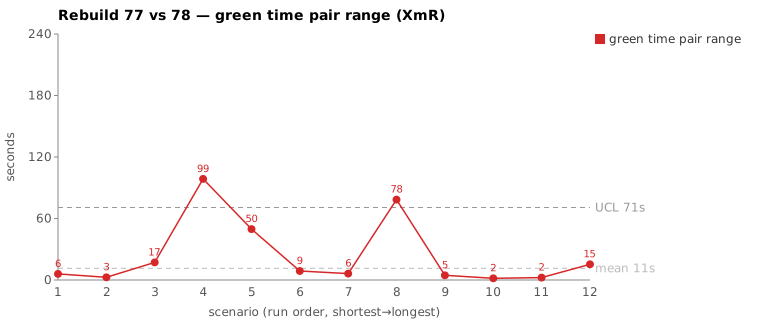
This is a pair-range study in the tradition of pbc-4445 and pbc-4849, on the same scenario that pbc-7374 examined for runs 73/74: Test step must have a valid object name validation. It is the widest green-phase pair on the 1664588662 tab for Rebuild77 vs Rebuild78 (both 2026-05-31, ~19:10 and ~20:59 EDT). The conclusion is common cause — no action. The point of writing it up is not a fix; it is to record why a 98.6 s spread on this scenario is the control chart doing its job, and to name the one legitimate input-level lever that remains.
By this stage the darmok-maven-plugin harness has been tuned about as far as it can be (the prompt fixes from pbc-7576, the active-time measurement work from pbc-7374). The system is stable. The remaining variation is the residual the chart is supposed to surface, and the discipline this case practices is not reacting to it as if it were special.
| Value | |
|---|---|
| Scenario | Test step must have a valid object name validation |
| Rebuild77 commit | 246104a |
| Rebuild78 commit | dfab839 |
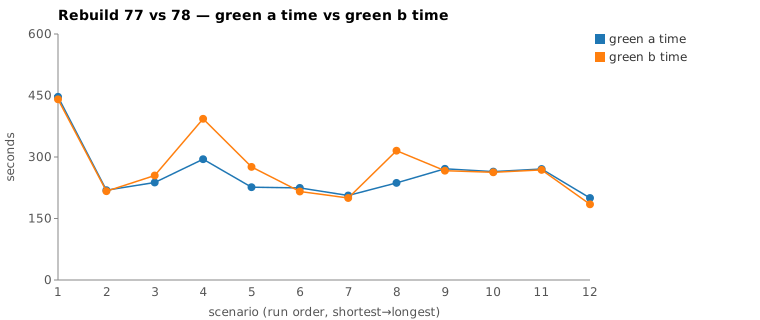
| Green-phase range | 98,600 ms (294,519 → 393,119) |
| Files patched | same 5 files, functionally equivalent |
| Diagnosed cause | common cause — exploration depth + one extra mvn iteration + server wait |
| Action | none to the worker/spec/prompt; input-level candidate: split this net-new-logic test (see Why No Fix) |
Charts
Scenarios are numbered in run order (shortest→longest); see the tables below for which scenario each index is.
What We Observed
The study scopes to green only. Local metrics.csv agreed exactly with the gsheet on both runs.
| Phase | Rebuild77 (246104a) |
Rebuild78 (dfab839) |
|---|---|---|
| Phase total | 497,617 ms | 695,202 ms |
| Red | 69,337 ms | 76,374 ms |
| Green | 294,519 ms | 393,119 ms |
| Refactor | 59,852 ms | 151,864 ms |
Green is two claude invocations sharing one --session-id (--model opus): a green-compile.md pass, then a green-verify.md --resume --effort low pass that does the locate-and-implement work. The mojo brackets:
| green-compile | green-verify | green (mojo bracket) | |
|---|---|---|---|
| R77 | ~54 s (19:03:29→19:04:23) | ~3:40 (→19:08:03) | 4:33 |
| R78 | ~51 s (20:49:26→20:50:17) | ~5:22 (→20:55:39) | 6:12 |
green-compile is near-identical (54 vs 51 s). The entire divergence is in green-verify. No silent stall (per-minute output buckets non-zero throughout), no >300 s inter-tool gap, no timeout, no retry — the stop-reason ledgers end cleanly on end_turn.
The committed code is functionally equivalent. Same 5 files change in both runs; TestStepIssueTypes.java is byte-identical; TestStepIssueDetector.java differs only in that R78 added a getFullName() fallback and null guards on top of R77’s plain getStepObjectName() → StepObjectRefFragments.getAll → isEmpty() check (and renamed the param testStep → theTestStep). Both pass mvn verify.
Where The Time Went
The reliable signal is the work-proxy counts, not an idle/active split. Both green windows, bracketed strictly to the mojo green times:
| Proxy | R77 | R78 |
|---|---|---|
| Reads | 19 | 19 |
| Writes | 2 | 2 |
| Edits | 2 | 3 |
| Grep | 5 | 12 |
| Glob | 0 | 2 |
| TodoWrite | 10 | 10 |
| Bash / mvn cycles | 2 | 3 |
| Assistant turns | 60 | 79 |
| Output tokens | 9,223 | 9,632 |
| Cache-read tokens | 3.69 M | 5.28 M |
R78 did one extra mvn verify -Dtest=RGRTest (a second fix-iteration), more than double the greps, and 19 more assistant turns — but produced essentially the same output volume (9.2k vs 9.6k tokens) and the same committed feature. It explored more to converge; it did not do different work.
A caveat on idle/active decomposition
Running jsonl-active-time.py over the two windows gives:
| Green session | Total | “Idle” | Tool | Gen | “Active” |
|---|---|---|---|---|---|
| R77 | 270.3 s | 196.0 s | 43.2 s | 31.0 s | 74.3 s |
| R78 | 370.3 s | 269.9 s | 59.9 s | 40.5 s | 100.4 s |
This is not trustworthy as “74 % of the gap was server idle.” Each assistant message is a single JSONL event with one timestamp; there is no event marking when a turn started streaming. So the tool_result → next-assistant interval the script labels “idle” swallows the model’s entire thinking + generation time for that turn, and the gen bucket (consecutive assistant messages) catches almost nothing inside a tool-use loop. The metric over-counts idle — a known limitation tracked under the active-time work (pbc-7374 motivates it; the idle figure itself is unreliable without per-token start timestamps). What is reliable: tool execution time is +16.7 s (the extra mvn cycle plus more greps), and that is the only slice of the 98.6 s gap we can defensibly attribute. The rest lives in the conflated generation+server-wait interval that single-timestamp events cannot decompose. We do not claim it as server idle.
The 2 vs 3 mvn cycles
The diverging segment, commands verbatim:
| # | Rebuild77 | Rebuild78 |
|---|---|---|
| 1 | mvn verify -Dtest=RGRTest > log.txt 2>&1 |
mvn verify -Dtest=RGRTest > log.txt 2>&1 |
| 2 | mvn verify > log.txt 2>&1 (full regression) |
mvn verify -Dtest=RGRTest > log.txt 2>&1 (second fix-iteration) |
| 3 | — | mvn verify > log.txt 2>&1 (full regression) |
R78’s extra targeted run is the visible cost of one more fix attempt. Around it, R78 grepped the live codebase (TestStepIssueDetector, createTestStep, instanceof ITestStep, the type enum) and — critically — only after its first edits did it Read ITestStep.java, discover getFullName(), and add the fallback in a second detector Edit. R77 wrote the plain form once and its full mvn verify passed.
This is the divergence: not a missing example, but post-conformance embroidery. Both runs read uml-interaction-main.md first and both conformed to its detector example. R78 then went on to consult the interface, found a method it could use, and elaborated. R77 stopped.
Classification
Common cause. The decision rule (the tampering gate): is there a defect in spec/prompt/harness that made one run do more or wrong work? No.
- Same spec, same generic
green-verify.mdprompt; both followed todo-2 (“conform touml-interaction-main.md”) and both conformed. - Functionally equivalent, both-passing committed code;
*IssueTypes.javabyte-identical. - No stall, no timeout, no retry.
- The measurable extra work (+1
mvncycle, +7 greps) is R78 taking a less-direct path and needing one more try to converge — ordinary model nondeterminism, exactly the “sometimes it needs more than one attempt” we expect.
The getFullName() fallback is the embroidery, and the test passes with or without it — so the test does not even prefer one form. Manufacturing a spec or prompt change to suppress this would be tampering: reacting to common-cause variation as if it were special, which increases variation rather than reducing it.
The Fix, or Why No Fix
No fix to the worker, spec, or prompt. Specifically:
- Not a UML-spec change. The
{Type}IssueDetector/{Type}Fragments.getAllexamples inuml-interaction-main.mdpredate these runs by weeks; R77 used them; R78 conformed to them and then elaborated from the interface. Adding more code to the interaction spec would not have stopped a post-conformance edit, and would push the spec from “show the key messages, like a sequence diagram” toward “dictate the implementation” — defeating its purpose. - Not a prompt change.
green-verify.mdalready requires conformance before implementing, and the model did. Forcing fewer tries would fight the design (run the scoped test, fix, re-run).
The one legitimate, input-level lever — and the reason this case is worth recording. Across the opus runs (65–78), this scenario carries the widest relative range (range/min ≈ 1.04, 192 k → 393 k); from run 67 onward it is the sole remaining outlier. The pattern across all twelve scenarios is clear: the high-variance ones (valid object name, valid step definition name, No component in first step) are the tests that create net-new detector/parsing logic for the first time; the low-variance ones reuse an established pattern. A first-creator has the largest solution space, so it explores most and varies most.
The control-chart reading is therefore: a point that sticks out is a signal to change the input, not the worker. The input here is the test itself. Splitting this net-new-logic scenario into smaller, single-behavior Test-Cases shrinks the solution space the worker must cover, which narrows the band — expected toward the ~100 k-ms floor — without flattening it (the first-creator stays its group’s ceiling, and an irreducible floor of model-exploration jitter + server wait remains regardless). That is variance reduction by reducing complexity, not chasing noise. No GH issue is filed for a code/spec fix; the candidate follow-up is a test-decomposition exercise on the net-new-logic scenarios.
Mapping to the Research
| Predicted symptom (pbc-research) | Observed here |
|---|---|
| Pair-range fires on an assignable cause | Refuted for this pair — it fired; the cause was common (exploration + one extra try + server wait) |
| Spec/prompt admits multiple valid paths, all pass | True and benign — plain and fallback forms both pass; the test doesn’t prefer either |
| Same-file output is not the disambiguator | Confirmed — same 5 files, *IssueTypes byte-identical |
| Cause sites in the producer/prompt, not either run | Refuted — no spec/prompt fix exists; the only lever is the test input |
| Exploration-depth (greps, reads) flags the shape | Partially — more greps and one extra mvn cycle in the slow run, but it is nondeterministic path choice, not a defect |
Where pbc-7374 found this scenario’s active time flat (the whole 73/74 spread was server wait), the 77/78 active work is genuinely +~26 s higher in R78 — yet the verdict is still common cause, because that extra work is nondeterministic exploration converging on the same spec, with no fixable instruction behind it. A real active-time difference does not automatically imply an assignable cause.
Findings by Variable
Each subsection records this run’s findings about one Wheeler variable. Read the same heading across the run sequence to see how our understanding of that variable evolved.
green time pair range
This run is a two-run comparison (Rebuild77 vs Rebuild78), and the green pair-range on this scenario is the widest on the tab — 98,600 ms (294,519 → 393,119). The verdict is common cause: same 5 files patched, functionally equivalent, both passing, with the only measurable extra work being R78’s one more mvn cycle and more greps. The pair was wide because the scenario is big (it creates net-new detector logic — see green time), not because of a spec, prompt, or harness defect; reacting to it as special would be tampering.
green time pair range moving range
No finding this run.
green time
This scenario’s absolute green time is large and its relative range is the widest across the opus runs (range/min ≈ 1.04, 192 k → 393 k), making it the sole remaining outlier from run 67 onward. The root lever is size: the high-variance scenarios (valid object name, valid step definition name, No component in first step) are exactly the ones that create net-new detector/parsing logic for the first time — the largest solution space — so they explore most and vary most. The input-level fix is to split these net-new-logic tests into smaller, single-behavior Test-Cases, which shrinks the solution space and narrows the band toward the ~100 k-ms floor without flattening it.
green time moving range
No finding this run.
scale & green tokens
Output volume was essentially identical across the pair (9,223 vs 9,632 tokens) despite R78’s longer wall-clock, so token scale did not track the time gap. One caveat: because this is a two-run comparison across different times of day (~19:10 vs ~20:59 EDT), a server/decode-rate confound cannot be cleanly separated from the work difference, though the +1 mvn cycle and extra greps account for the only defensibly attributable slice (+16.7 s tool time).
warm-up position
No finding this run.
Open Questions From This Case
- Does splitting the net-new-logic scenarios compress their range toward the floor? Predicted: range drops toward ~100 k ms while the first-creator stays its group’s ceiling. This is the testable next step and the only action this case recommends.
- What is the irreducible floor? It is the sum of model-exploration jitter and server time-to-first-token. Quantifying it cleanly needs per-token start timestamps the JSONL does not currently carry (tracked with the active-time work).