PBC for Claude Code - Rebuild85 Token Anatomy Case Study
- Context
- Charts
- What a green output token is actually made of
- Token divergence is decoupled from code divergence
- Winner selection: shortest time is good enough
- Scaling on tokens is sound
- Control: common cause
- Findings by Variable
- Conclusions
Context
This is a batch-level companion to pbc-83 and pbc-84, and the first run with green output tokens logged as first-class metrics columns (issue #440): every Darmok metrics row now carries green_tokens_a and green_tokens_b, the per-half sum of usage.output_tokens over each green session’s JSONL, captured at green-completion before the winner’s session continues into refactor. Earlier batches recovered those numbers post-hoc from the JSONL; Rebuild85 has them in the row.
Where pbc-83/84 used the token-scaled pair-range gate to split a pair’s wall-clock range into work versus generation-rate, this batch turns the microscope on the token signal itself and asks the question the gate assumes an answer to: what is a green output token actually made of, and does a bigger token count mean a different — or worse — result? The answer reframes how much weight the token axis can carry.
Of the 20 Rebuild85 scenarios, 12 carry a green-token pair; 8 show 0/0 (the token read didn’t resolve for those — a session-resolution / version boundary in the batch, not a real zero). The anatomy below is drawn from the 12, with the four widest-divergence pairs decomposed in full.
Charts
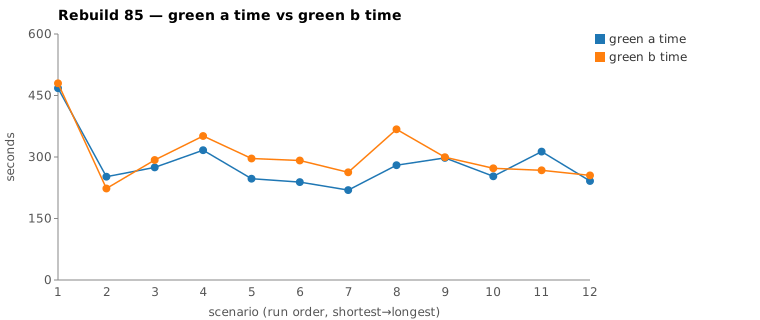
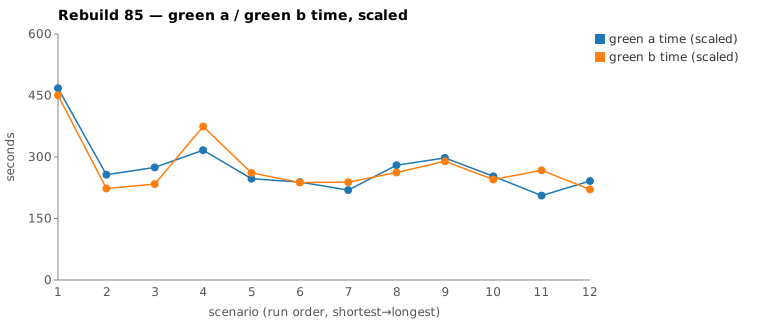
Scenarios are numbered in run order (shortest→longest); see the tables below for which scenario each index is.
What a green output token is actually made of
For the four widest-divergence pairs (eight green sessions), each assistant event’s real output_tokens was apportioned across its content blocks by size and bucketed: thinking (extended-thinking blocks), narration (assistant text), artifact (the content/new_string of Write/Edit), and orchestration (the JSON arguments of every other tool — Read, Grep, Bash, Glob, TodoWrite, ToolSearch).
| Commit | half | tokens | turns | thinking | artifact | orchestration |
|---|---|---|---|---|---|---|
caf4e3527 |
_a | 5753 | 51 | 1.0% | 16.5% | 82.2% |
caf4e3527 |
_b | 7471 | 51 | 0.9% | 26.9% | 69.5% |
0b70d126c |
_a | 6710 | 48 | 0.6% | 15.6% | 83.0% |
0b70d126c |
_b | 7935 | 58 | 1.2% | 14.0% | 84.0% |
db83b0133 |
_a | 8375 | 59 | 0.8% | 15.1% | 83.5% |
db83b0133 |
_b | 7134 | 54 | 0.9% | 20.4% | 78.5% |
2fca9ed98 |
_a | 7410 | 50 | 0.9% | 19.7% | 75.9% |
2fca9ed98 |
_b | 6433 | 48 | 1.3% | 22.2% | 75.7% |
Three things hold across every half:
- Thinking is ~1%. Green-phase claude emits almost no extended-thinking output (2–6 short thinking blocks per session, plaintext, not redacted — so this is measured, not hidden). Higher green tokens is not “more thinking.”
- Orchestration dominates (~70–84%). The bulk of green output is tool-call arguments — re-emitting the
TodoWritelist on every update,Grep/ToolSearchqueries,Readpaths,Bashcommands. This scales with the number of tool round-trips (turn count, 48–59 here), i.e. how much the agent explored and re-stated its plan. - Artifact is second (~14–27%). The actual code-and-comments written. Real, but the minority component.
So green output tokens is, in plain terms, a process-verbosity / round-trip-count proxy — not a cognitive-effort proxy. (The per-bucket split is char-apportioned and approximate; verbose tool-arg JSON tokenizes a little denser than prose, so orchestration is if anything slightly overstated and artifact slightly understated — not enough to move the ranking or the thinking ≈ 0 result.)
Token divergence is decoupled from code divergence
The decomposition raises the obvious follow-up: when one half runs hotter on tokens, is the artifact it produced bigger or different? The ground truth is in the JSONL — every Write carries the full file body, every Edit its old/new strings — so each half’s actual output can be reconstructed and hashed without any git archaeology (the loser half leaves no commit; only the winner is amended onto red).
The result inverts the intuition the pair-range invites:
| Commit | token gap | artifact across the halves |
|---|---|---|
caf4e3527 |
1718 (23%) — widest | byte-identical (all 4 Write/Edit payloads same SHA) |
0b70d126c |
1225 (15%) | different SHAs |
db83b0133 |
1241 (15%) | different SHAs |
2fca9ed98 |
977 (13%) | different SHAs — diffed: cosmetic (import-cleanup granularity, same logic) |
The widest token-gap pair in the batch produced byte-for-byte identical code — same two Writes, same two Edits, same hashes. The entire 1,718-token gap was process overhead: _b reached the exact same bytes via a more verbose path. Narrower-gap pairs do differ in bytes, but the one diffed in full (2fca9ed98) differs only in how aggressively each half pruned now-unused imports — the validation logic is identical. No functional difference surfaced in any pair examined.
Two conclusions follow, and they matter for how the token axis is read:
- Token gap does not predict code divergence. The largest gap gave identical code; smaller gaps gave cosmetic differences. You cannot read a wide token-pair-range as “the halves did materially different work on the artifact” — the divergence lives in orchestration churn, which reaches the same destination.
- Both halves always pass the same red test, so any byte difference is housekeeping the test doesn’t pin (import tidiness, edit granularity), not behavior. This is the SHA-level confirmation of pbc-83/84’s “same output files” observation.
Winner selection: shortest time is good enough
Ranking the 12 pairs two ways — by shorter green time (the current rule, #434) versus fewer green tokens — disagrees on 8 of 12. caf4e3527 is the sharpest: the time rule kept _b (faster wall-clock) even though _b spent 1,718 more tokens, while the token rule would keep the leaner _a.
That looks like an argument to switch the winner to fewest-tokens. The artifact comparison removes it: since the lower-token half is not producing a leaner or different file — caf4e3527’s halves are identical, the rest differ only cosmetically — there is no code-quality payoff to picking by tokens. The leaner half merely churned less to reach the same result. Shorter wall-clock is therefore good enough as the selection rule; the token count is diagnostic, not a better tiebreak. #435 stays as is.
Scaling on tokens is sound
The token-scaled pair-range (pbc-83) normalizes a pair to one generation rate so the residual range reflects work, not server jitter. A natural worry was whether the artifact slice should be exempted from the rate normalization. It should not: per-token generation rate is global — server load slows the emission of every output token equally, artifact and orchestration alike. So scaling on the total green-token count is correct; there is no token subtype that escapes the rate. Using the logged green_tokens_a/_b totals for scaling is sound.
Control: common cause
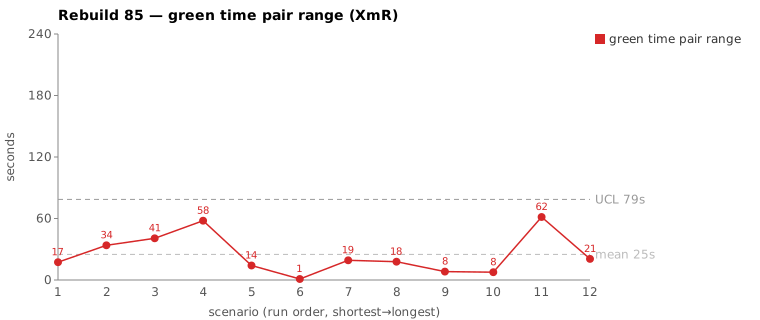
Nothing in Rebuild85 reaches an assignable cause. The widest token divergence produced identical code; the widest others produced cosmetic-only differences; thinking is flat near zero across all halves; both halves of every pair pass the same test. The run sits inside its control limits: the green pair-range XmR chart — built on the token-scaled ranges — has range_mean 24,985 ms, MR̄ 20,185 ms, and a UCL of 78,676 ms (~79 s), with every scenario’s pair-range inside the limit and none excluded (exclude_from_limits all FALSE). That is in line with Rebuild84’s comparable pair-range UCL (~80K ms). So the variation is common cause. Investigating any single pair this far inside the limits would be tampering. The honest read is the same as the prior two batches, now with a stronger artifact-level proof: even where the harness varies most on tokens, the result is equivalent.
Findings by Variable
Each subsection records this run’s findings about one Wheeler variable. Read the same heading across the run sequence to see how our understanding of that variable evolved.
green time pair range
The widest token-gap pair, caf4e3527, produced byte-identical code (all four Write/Edit payloads same SHA) despite a 1,718-token (23%) gap, so the in-run divergence lived entirely in orchestration churn — _b reached the exact same bytes via a more verbose path. The other examined pairs differed only cosmetically (e.g. 2fca9ed98’s import-cleanup granularity), with no functional difference in any pair; the leaner half merely churned less to reach the same result. This is common cause: every pair’s token-scaled range sits inside the control limit, and the result is equivalent even where the halves diverge most.
green time pair range moving range
No finding this run.
green time
No finding this run.
green time moving range
No finding this run.
scale & green tokens
A green output token is a process-verbosity / round-trip-count proxy: orchestration (tool-call arguments) dominates at ~70–84%, artifact is second at ~14–27%, and thinking is ~1% — so a higher token count is not “more thinking” and does not predict code divergence. Per-token generation rate is global — server load slows the emission of every output-token subtype equally — so scaling a pair on its total green-token count (the logged green_tokens_a/_b) is sound; no token subtype escapes the rate. Ranking the 12 pairs by fewest tokens disagrees with the shortest-time rule on 8 of 12, but since the lower-token half is not producing a leaner or different file, there is no code-quality payoff to picking by tokens; tokens stay diagnostic, not a tiebreak.
warm-up position
No finding this run.
Conclusions
- More tokens does not mean a different or leaner file. Higher green tokens is dominated by tool-orchestration churn (~75%), with thinking ~1% and artifact a minority — and the widest token-gap pair produced byte-identical code. So picking the shortest-time winner is good enough; there is no leaner-artifact reason to pick by tokens. #435 stays as is.
- Using tokens for scaling is OK. Generation rate is global across all output-token types, so normalizing a pair on its total green-token count is the right way to separate work from rate.
- All of this is common-cause variation, consistent with the run sitting under its pair-range control limit (UCL 78,676 ms this run, ≈ 80K ms for Rebuild84). The next read comes after #435 and #436 land.