PBC for Claude Code - Rebuild79 vs Rebuild80 Case Study
- Context
- Charts
- What We Observed
- Where The Time Went
- Classification
- The Fix, or Why No Fix
- Mapping to the Research
- Findings by Variable
- Open Questions From This Case
Context
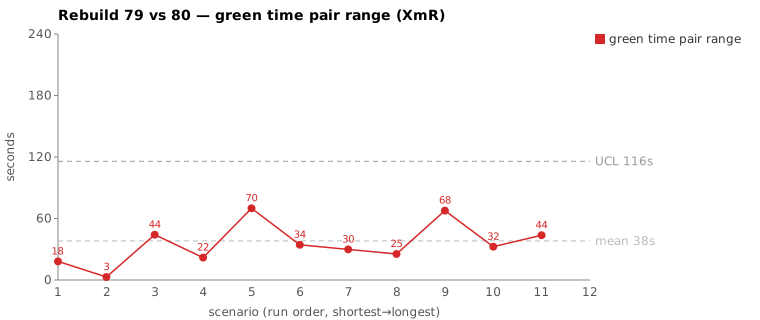
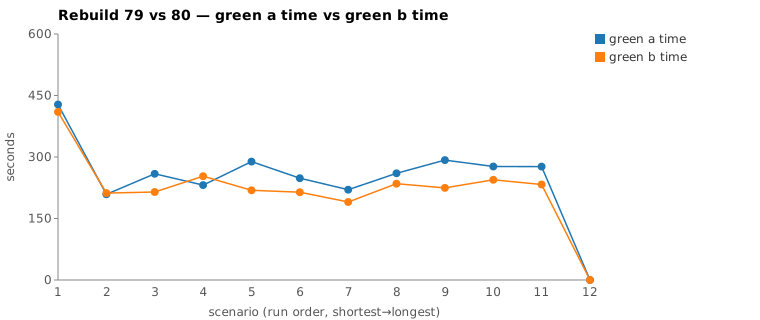
This page is a worked comparison in the same tradition as pbc-4445, pbc-4849, and pbc-7576, and it lands on the same side of the classification gate as pbc-7374: common cause, no scenario fix. The scenario Test step must have a valid step definition name validation ran against sheep-dog-grammar on branches Rebuild79 (early-morning EDT) and Rebuild80 (midday EDT). It topped the green-phase pair-range sheet at 70.0 s (288,806 ms vs 218,834 ms) — the widest pair covering both runs.
The investigation found no assignable cause. The two runs took the same route — same exploration sequence, same three files patched, same two mvn verify cycles, the same number of tool calls (33 vs 32) — and produced functionally identical code. The entire 70 s gap is server-side decode throughput: the 1 AM run generated tokens at roughly half the rate of the midday run. The cleanest single tell is that the faster run (Rebuild80) emitted more output tokens (7,971 vs 5,962) while finishing 70 s sooner. You cannot do more work in less time and have the gap be about work. The gap is about how fast the model server was decoding that day.
| Rebuild79 | Rebuild80 | |
|---|---|---|
| Scenario | Test step must have a valid step definition name validation |
(same) |
| Commit | 8a3f1a2b |
44aa20cb |
| Scenario start (EDT) | 01:08:49 | 12:47:52 |
| Green-phase metric | 288,806 ms | 218,834 ms |
| Green-phase range | 70,000 ms (70.0 s) | |
| Files patched | TestStepIssueTypes, TestStepIssueDetector, ValidateActionImpl |
same three |
| Resulting code | functionally identical | |
| Verdict | common cause — no scenario fix | |
| Action | measurement-level only (chart decode-normalized / active time per pbc-7374) |
This is the second “common cause — no action” result in the series (after pbc-7576 Case A), and the purest: prior common-cause cases still had a navigation difference (Read-heavy vs Grep-heavy) to explain. Here even navigation is identical, leaving decode speed as the only variable.
Charts
Scenarios are numbered in run order (shortest→longest); see the tables below for which scenario each index is.
What We Observed
The study scopes to the green phase only. Red and refactor are reported for context but not analyzed.
| Rebuild79 (01:08 EDT) | Rebuild80 (12:47 EDT) | |
|---|---|---|
| Commit | 8a3f1a2b |
44aa20cb |
| Phase total | 9:31 (571,104 ms) | 6:48 (408,463 ms) |
| Red phase | 1:12 (72,374 ms) | 1:07 (67,177 ms) |
| Green phase | 4:48 (288,806 ms) | 3:38 (218,834 ms) |
| Refactor phase | 1:55 (115,642 ms) | 1:00 (60,577 ms) |
Every phase ran longer on Rebuild79 — red +5 s, green +70 s, refactor +55 s. That uniform stretch across all three independent phases is itself a fingerprint of a slow-server day rather than a scenario-specific defect: a spec/prompt gap would inflate one phase, not scale all three.
Both green phases split into two claude calls against one shared session id: a short green-compile (--print … green-compile.md) that checks log.txt for compilation errors, then a green-verify (--resume … --effort low … green-verify.md) that reads the JaCoCo shortlist, implements the change, and runs mvn verify. The mojo-log brackets give the sub-segment split:
| Green sub-segment | Rebuild79 | Rebuild80 | Δ |
|---|---|---|---|
green-compile (Running → Writing jacoco-shortlist) |
54.7 s | 47.3 s | 7.4 s |
green-verify (Writing jacoco-shortlist → Completed) |
213.1 s | 151.0 s | 62.1 s |
| green total (mojo bracket) | 267.8 s | 198.3 s | 69.5 s |
allowlist + mvn verify tail |
20.9 s | 20.5 s | 0.4 s |
| green metric | 288.8 s | 218.8 s | 70.0 s |
The spread lives in green-verify (the implement-and-build call). The post-implementation mvn verify tail is identical to within 0.4 s — the build itself is not the cause.
Where The Time Went
Measured over each session’s green window (compile + verify), from the per-session JSONL:
| Metric | Rebuild79 | Rebuild80 | Note |
|---|---|---|---|
| green wall-clock (mojo bracket) | 267.8 s | 198.3 s | +69.5 s on R79 |
| assistant turns | 49 | 48 | ~equal |
| tool calls | 33 | 32 | R79 +1 (one extra Edit) |
| TodoWrite | 10 | 10 | identical |
| Read | 11 | 11 | identical |
| Grep | 5 | 5 | identical |
| Edit | 4 | 3 | R79 split one detector edit in two |
Bash (mvn) |
2 | 2 | identical |
| thinking blocks | 3 | 3 | identical |
| output tokens | 5,962 | 7,971 | faster run produced MORE |
| cache-read tokens | 2,975,768 | 2,892,921 | ~equal |
| decode rate (output tok / green min) | ~1,366 | ~2,503 | R80 ~1.8× faster |
mvn verify cycles |
2 (scoped -Dtest=RGRTest + full) |
2 (same) | identical |
| stop reasons | all clean (end_turn / tool continuations) |
all clean | no stall, no retry, no hang |
The work proxies are the same column twice over: same 11 Reads, same 5 Greps, same 2 mvn cycles, same three files patched, turn counts within one. The only structural difference is that Rebuild79 made one extra Edit — it split the TestStepIssueDetector change into an import edit and a logic edit, where Rebuild80 did both in one. That is a 9 s difference at most, and it cuts the wrong way: the run with one more edit and fewer output tokens still took 70 s longer.
The same route, at two speeds (the “divergence” that isn’t)
The tool-call timelines run in lockstep. Both open ToolSearch → seed TodoWrite → Read uml-package.md → Grep "COMPILATION ERROR" → Grep "Guice configuration errors" (green-compile), then Read jacoco-shortlist.md → read the three issue-detector source files → Read the runner log → Grep "FAILED|BUILD FAILURE|AssertionError" → make the edits → mvn verify -Dtest=RGRTest → mvn verify (green-verify). The two Bash commands are character-for-character identical:
cd /home/farhan/.../sheep-dog-grammar && mvn verify -Dtest=RGRTest > log.txt 2>&1
mvn verify > log.txt 2>&1
The mvn segments are nearly equal: scoped build ~23 s on both; full verify ~30 s (R79) vs ~24 s (R80), a 6 s difference attributable to cold-vs-warm Maven, not the model. Subtract the ~6 s of mvn variance and ~64 s of the 70 s gap is pure model time — the same turns, each one taking longer to think and decode on the 1 AM run.
The per-minute output-token buckets make the throughput difference visible directly:
| R79 green minutes | R80 green minutes | |
|---|---|---|
| peak output tok/min | 1,667 (05:11) | 3,827 (16:50) |
| profile | 1286 / 1667 / 1397 / 1224 / 388 | 2044 / 3827 / 1560 / 540 |
Same number of tokens’ worth of work, decoded at roughly half the rate — so the wall-clock stretches by roughly 2×, exactly the green-verify Δ. There is no command one run ran and the other skipped; there is no file one run read and the other didn’t. There is only a slower server.
Classification
Verdict: common cause. No assignable cause is present.
Evidence, work-proxy by work-proxy:
| Proxy | R79 | R80 | Equivalent? |
|---|---|---|---|
| Files edited | TestStepIssueTypes, TestStepIssueDetector, ValidateActionImpl |
same three | ✅ |
| Edit count | 4 | 3 | ≈ (R79 split one edit; same net change) |
| Read / Grep counts | 11 / 5 | 11 / 5 | ✅ identical |
mvn verify cycles |
2 (scoped + full) | 2 | ✅ identical |
| Resulting code | new step definition name validation wired through detector + impl |
same wiring, same enum string | ✅ functionally identical |
| Output tokens | 5,962 | 7,971 | faster run produced more |
| Stalls / retries / timeouts | none | none | ✅ |
| Decode rate | ~1,366 tok/min | ~2,503 tok/min | ❌ R80 ~1.8× faster |
The only proxy that differs is decode rate, and decode rate is not something any spec, prompt, or harness change can control — it is queue wait + context prefill (TTFT) + per-token decode speed on the model server, which varies with time-of-day load and model-of-the-day. Both runs followed the green prompts exactly as written, converged on the same code, and passed mvn verify on the first full build. There is no instruction that would have made the slow run faster, because the slow run did nothing wrong — it did the same thing, slower.
This is common-cause variation by definition: inside the system’s normal behavior, no single removable cause, and the next run could land anywhere on the same spread for reasons unrelated to this scenario.
The Fix, or Why No Fix
No scenario-level fix is warranted, and proposing one would be tampering.
There is no tempting “fix” to even reach for here. Unlike pbc-7576 Case A (where one run was Read-heavy and the other Grep-heavy, inviting a “bias toward Grep” non-fix) or pbc-4849 (where one run typed the wrong grep regex), the two runs in this pair did identical work. Biasing the prompt toward any tool, reordering any step, or tightening any spec would change nothing about the gap, because the gap is not in anything the prompt controls. Editing the scenario to chase a 70 s wall-clock difference that is entirely server decode throughput is the textbook Deming/Wheeler tampering failure — reacting to common-cause noise as if it were a special cause, which increases variation rather than reducing it.
The legitimate follow-ups are at the measurement level, not the scenario level:
- Rank on decode-normalized / active time, not wall-clock. This pair is the strongest argument yet for the pbc-7374 active-time work: the wall-clock sheet ranked it #1, but normalized by output tokens (5,962 vs 7,971) or decode rate the pair is inverted — the “slower” run did less generation. A decode-normalized metric (e.g. wall-clock per output token, or idle-stripped active time) would push this pair off the top of the sheet and stop it consuming investigation budget.
- Apply SPC limits to selection. Treat each scenario’s green series as an individuals/moving-range (XmR) chart and only investigate points outside 3σ. A uniform slow-server day that inflates every phase (red +5 s, green +70 s, refactor +55 s here) is common cause by construction and should be left alone.
Both follow-ups are tracked as the open active-time / moving-range discussions; no scenario GH issue is appropriate here.
Mapping to the Research
| pbc-research prediction | What we observed |
|---|---|
| Pair-range flags “look here”, not “something is broken” | Confirmed — the widest pair on the sheet had zero assignable cause. The flag is triage, not diagnosis. |
| Same-artifact does not imply same-path | Inverted here — same artifact and same path. Even the navigation matched; only decode speed differed. The cleanest same-everything case in the series. |
| Wall-clock fuses work with server overhead | Confirmed in the extreme — ~64 s of the 70 s gap is pure decode/TTFT overhead with the work held constant, and the faster run did more work. |
| Assignable cause appears on first or second pass | Did not hold — no assignable cause exists. The second “common cause, no action” verdict in the series (after pbc-7576 Case A). A legitimate outcome. |
Findings by Variable
Each subsection records this run’s findings about one Wheeler variable. Read the same heading across the run sequence to see how our understanding of that variable evolved.
green time pair range
This was the widest pair on the sheet (70.0 s), but the width was NOT a vague or under-specified test. Both runs took the same route, patched the same three files (TestStepIssueTypes, TestStepIssueDetector, ValidateActionImpl), and produced functionally identical code — the only structural difference was Rebuild79 splitting one detector edit into two, worth at most ~9 s. The pair-range flag here is triage pointing at “look here”, and the answer was common cause, not a scenario fix.
green time pair range moving range
No finding this run.
green time
No finding this run.
green time moving range
No finding this run.
scale & green tokens
This is the canonical server-decode-noise case. Rebuild79 (01:08 EDT) and Rebuild80 (12:47 EDT) ran ~11 h apart and did identical work, yet the faster run (Rebuild80) emitted MORE output tokens (7,971 vs 5,962) while finishing 70 s sooner — so the whole pair range is decode-rate / time-of-day noise (~1,366 vs ~2,503 tok/min, R80 ~1.8× faster), not input. You cannot do more work in less time and have the gap be about work, which makes the case for ranking on a decode-normalized / active-time basis and motivates token-scaling and concurrent same-commit pairing.
warm-up position
No finding this run.
Open Questions From This Case
- How often is the widest wall-clock pair an inversion? This pair’s faster run did more generation. If an audit of recent top-of-sheet pairs finds several such inversions, the case for decode-normalized ranking is no longer theoretical — it is correcting a metric that actively mis-ranks.
- Is decode rate loggable per run? If Darmok recorded output-tokens and wall-clock per
claudecall, a decode rate (tok/s) per run would let the sheet flag “slow-server day” pairs automatically and exclude them from pair-range selection without a transcript walk. - Where is the active-time / XmR work anchored? Both measurement follow-ups depend on the idle/active definition and the SPC framing being settled; neither has a GH issue yet. They should get one before the sheet’s ranking column changes.