PBC for Claude Code - Rebuild84 In-Run Pairs Case Study
- Context
- Charts
- The token-scaled pair-range (recap)
- Pair 1 —
b9d893a: rate jitter (common cause) - Pair 2 —
8383ee6: a small work-volume difference (common cause via the walk) - Root cause across the two
- A third lens: token divergence vs wall-clock range
- The Fix
- Mapping to the Research
- Findings by Variable
- Open Questions From This Case
Context
This is a batch-level companion to pbc-83, using the same in-run pair methodology: since issue #434 every Darmok scenario runs its green phase twice — worktree _a and worktree _b, both branched from the same red commit, sequentially minutes apart — and keeps the shorter. The pair-range is |green_a − green_b| from a single metrics row, so the model-of-the-day, the red commit, and the server window are all held constant across the two halves. What’s left in the range is work versus per-token generation rate, and the token-scaled pair-range gate splits them.
Where Rebuild83 produced one example of each of the gate’s three regimes, Rebuild84’s two widest pairs both land within the token-similarity threshold — neither half did materially different work — and both resolve to common cause. One is pure rate jitter; the other is a small exploration-volume difference the divergence walk clears. There is no beyond-threshold pair in the batch’s worst two: the slowest scenarios this run were slow because of how the time decoded, not because either half was driven down a longer path.
| Scenario | Commit | Green _a |
Green _b |
Range | Token diff | Regime → verdict |
|---|---|---|---|---|---|---|
| This object step definition doesn’t exist validation | b9d893a |
5:25 | 4:09 | 1:15 | 0.3% | within / small scaled range → rate jitter, common |
| Test suite name should start with a capital letter validation | 6:27 | 7:31 | 8383ee6 |
1:03 | 7.8% | within / large scaled range → small work-volume diff, walk → common |
(Bold = the winning half that was brought back and refactored.) Both ranges (75s, 64s) sit well under the run’s range UCL of 125.6s — neither breaches the 3σ limit. The batch is in statistical control.
Charts
Scenarios are numbered in run order (shortest→longest); see the tables below for which scenario each index is.
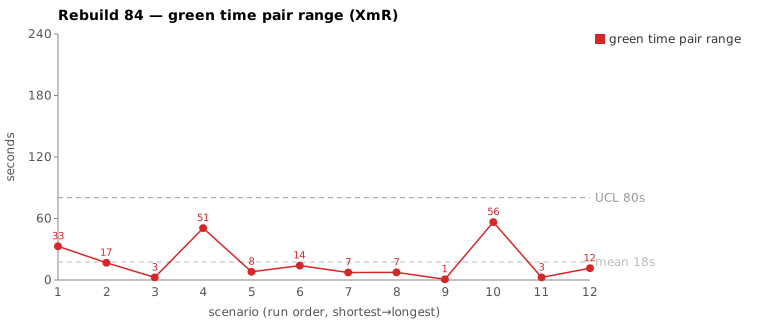
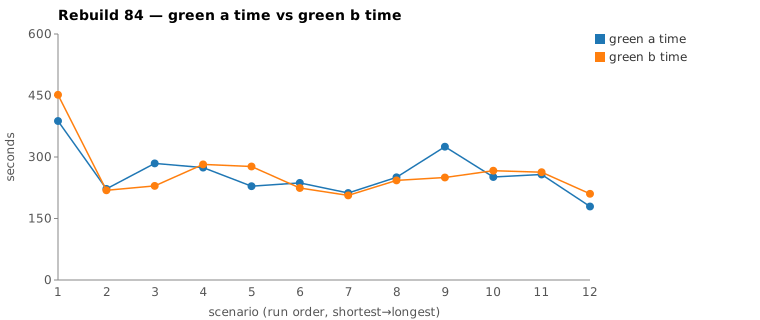
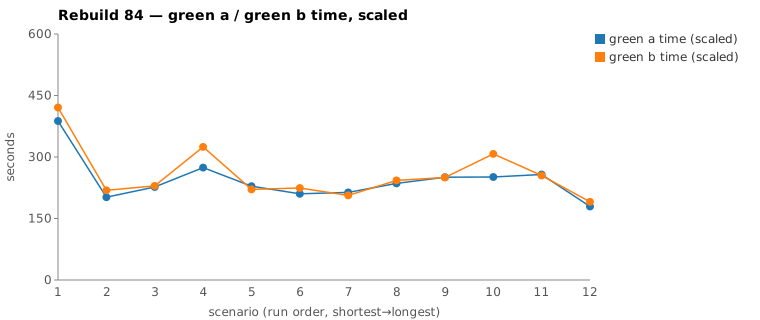
The token-scaled pair-range (recap)
Wall-clock fuses real work (closely tracked by output tokens generated) with the per-token generation rate (server load, queue, context-prefill jitter — uncontrollable). The gate, computed off each half’s green-phase JSONL, is two numbers:
- Token similarity. Within
TOKEN_SIMILARITY_THRESHOLD(default 15%), the two halves did near-equivalent work; beyond it, one generated materially more. - The scaled range. Within threshold, scale the slower half to the faster half’s per-token rate. The scaled range is the work-attributable part of the gap; the rate overhead (
raw − scaled) is generation-rate jitter — not recoverable by any input change.
Both Rebuild84 pairs are within threshold, so both get scaled — and the two scaled ranges are what separate them: pair 1’s is ~0, pair 2’s is not. The full three-regime derivation is in pbc-83.
Pair 1 — b9d893a: rate jitter (common cause)
_a (loser) |
_b (winner) |
|
|---|---|---|
| Green wall-clock | 5:25 | 4:09 |
| Green output tokens | 6,925 | 6,905 |
| Read / Grep | 13 / 6 | 12 / 6 |
mvn verify cycles |
2 | 2 |
| Edit | 4 | 4 |
Token similarity 0.3% (within threshold); raw range 75s. Scaling _a to _b’s rate gives a scaled range of 1s and 74s of rate overhead — the entire 75-second gap is generation-rate jitter. At equal rate the two halves are within one second of each other.
The proxies leave nothing to explain: 13 vs 12 Reads, 6 vs 6 Greps, 4 vs 4 Edits, 2 vs 2 mvn cycles, the same four edits implementing the same single validation rule, and no stall in either per-minute token bucket (every minute non-zero). This is the cleanest regime — equivalent work, the range dissolves under scaling. Common cause — no fix. It is the Rebuild84 analogue of pbc-83’s 62c1749c.
Pair 2 — 8383ee6: a small work-volume difference (common cause via the walk)
_a (winner) |
_b (loser) |
|
|---|---|---|
| Green wall-clock | 6:27 | 7:31 |
| Green output tokens | 11,984 | 13,001 |
| Total tool calls | 59 | 75 |
mvn verify cycles |
4 | 4 |
| Grep | 9 | 24 |
| Write / Edit | 5 / 4 | 5 / 5 |
Token similarity 7.8% (within threshold), raw range 64s — but scaling tells a different story than pair 1: scaled range 33s with only 31s of rate overhead. The per-token rate was about equal; roughly half the gap is work volume, not jitter. So the case routes to the divergence walk.
Both halves open identically (the ${logPath} COMPILATION ERROR / Guice configuration errors grep, the uml-package.md read), then split on exploration style. _a located the wiring directly — Glob **/objects/xtext/ValidateAction.java, Glob **/impl/TestConfig.java, read, write. _b hunted for the same target: 24 Greps vs _a’s 9, walking a chain of candidate names —
Grep "interface ValidateAction"      Grep "XtextValidateAction"
Grep "TEST_SUITE_NAME_ONLY"          Grep "TestSuiteIssueTypes"
Grep "TestSuiteIssueDetector"        Grep "XtextValidateAnnotation"
Grep "ValidateAnnotationImpl"        Grep "TestStepIssueTypes"  ...
— sixteen more tool calls to reach the same insertion point _a found by Glob. The decisive observations: identical outcome (both wrote the same files and passed), 4 vs 4 mvn cycles, comparable Write/Edit counts (5/4 vs 5/5), and only a 7.8% token difference despite the 16 extra calls — Greps are cheap on output, so _b’s extra steps cost search time, not materially more generation. This is the Grep-heavy-vs-Glob-direct nondeterminism pbc-6768 and pbc-83’s 0f4deff8 named — equally-valid exploration luck, not a spec ambiguity forcing one half down a longer path. Common cause.
What would tip this to assignable is if _b’s extra grepping traced to a genuine ambiguity in the test case that _a got to skip. It doesn’t: both were looking for the same wiring; _b just took more searches to find it.
The fix that already held. This exact scenario — “suite name capital” — was the assignable case in pbc-7576 Case B, where one run burned 3.5 minutes hunting ~/.m2 and dependency jars for classes it had already decided to create. The fix there was to have green-compile read uml-package.md and the interaction specs before the log (#415), so the shared session carries “spec’d ⇒ create” into the search. In Rebuild84 that fix is visibly holding: _b’s 24 greps stay inside the project tree — ValidateAction, IssueTypes, IssueDetector — and never escape into ~/.m2 jar-hunting. The same scenario that was assignable two batches ago is now in-control. The residual variance is search-order luck within the project, which no instruction can null out.
Root cause across the two
No spec gap, no prompt defect, no producer/consumer mismatch in either pair. Run the pbc-6768 checklist and every box comes back clean. What remains is common-cause variation in two of the gate’s flavors: per-token rate jitter (b9d893a) and a small nondeterministic difference in exploration volume / style (8383ee6). Neither has a recoverable slice — there is not even a silent stall this time (every per-minute bucket in all four halves is non-zero). The batch’s two worst pairs being both within-threshold and both common cause is the strongest possible read that the harness is in control: even where it varies most, the work was equivalent.
In Wheeler/Deming terms, investigating points this far inside the limits — both under a 125.6s UCL — would be tampering. The honest result is “the system is in control,” and pair 2 adds a second, sharper claim: a scenario that was assignable under an earlier harness is now common cause under the fixed one. That is the assignable-cause hunt working as designed — the special cause was found, fixed, and has stayed fixed.
A third lens: token divergence vs wall-clock range
Picking the batch’s two widest pairs by wall-clock range is only one way to rank it. Rank the same 12 scenarios by token divergence between the halves and a different two come to the top — and they are nearly invisible on the range chart:
| Scenario | Commit | Token diff | Raw pair-range | Range rank |
|---|---|---|---|---|
| Test step must have a valid object name validation | 7476bbb |
15.6% | 8s | near-bottom |
| This object step definition parameter set doesn’t exist validation | 1dd042e |
18.4% | 15s | near-bottom |
Both cross the 15% token-similarity threshold — the halves did materially different work — yet both finished within ~8–15 seconds of each other. The reason is decode rate: the extra work was absorbed by faster per-token generation, so the wall-clock pair range never registered it. A range chart reads these two as among the most reproducible in the batch; the token axis reads them as the least.
What the higher-token half actually did extra, in both cases, was search/comprehension depth of the issue-detector + interface hierarchy, not divergent production code:
7476bbb—_bran 20 Reads vs_a’s 15, reading deeper into theTestStepIssue*interface surface before the identical 2-Write / 2-Edit implementation. Both passed, 2mvncycles each.1dd042e—_bran 9 Greps vs_a’s 4 (plus 4 more Reads and one extra Edit) walking theIRow/RowIssueDetector/RowIssueTypestree ("interface IRow","class.*IRow",RowIssueDetector|RowIssueTypes…)._afound its target with fewer searches.
In both the leaner, fewer-token half won (was brought back), and the production output was the same files. So the divergence walk still lands on common cause — exploration-depth nondeterminism, no spec ambiguity forcing two valid implementations. But these are the closest-to-assignable signal in the batch, and they point the same direction as pbc-7576’s Case B and pbc-83: the over-token half is consistently the one hunting for the right insertion class, the symptom of jacoco-shortlist.md / uml-interaction guidance not always pinning the exact class to edit. Not a per-pair fix; the standing distributional lever (“point the prompt at the exact file/class”) if it recurs.
The methodological takeaway outlives this batch: wall-clock pair-range and token pair-difference are two orthogonal reproducibility axes, and a scenario can be quiet on one while loud on the other. A fast-decode day can mask a real work divergence in the time range (a false “reproducible”); the token difference catches it. Screen on both, not just the range the selection sheet ranks by. This is the dual of the long-known caveat that a low range on a big test can be luck rather than clarity — here a low range on an ambiguous-enough-to-diverge test is decode speed rather than agreement.
The Fix
None at the scenario level — proposing one would be tampering, and pair 2 specifically shows the relevant special cause was already fixed upstream. The only standing, system-level levers are the distributional ones from pbc-6768 and pbc-83:
--effortcontrol (#426) to lower the rate-overhead band itself, distributionally, rather than chasing any one pair.- Smaller scenarios — splitting net-new-logic Test-Cases into single-behavior cases shrinks the solution space and narrows the band toward its floor. Neither Rebuild84 pair is a net-new-logic case (both are validation-rule wirings), which is consistent with both landing within threshold.
Mapping to the Research
| Predicted (pbc-research) | Observed across the two |
|---|---|
| Wide pair-range fires the signal | yes — 1:03 and 1:15, both flagged for review |
| Each run individually in-control | yes — every half a typical green for its scenario, both ranges under UCL |
| Both halves pass the test | yes — all four |
| Two work-trees differ | no — same outcome each pair; the variance is in rate / exploration, not code |
Both are pure-path cases in the pbc-4849 / pbc-6768 sense — same output, the variance entirely in how the worker got there. The token-scaled range puts a number on it: pair 1’s gap is 1s of work plus 74s of rate; pair 2’s is 33s of work-volume plus 31s of rate. No part of either points at the input.
Findings by Variable
Each subsection records this run’s findings about one Wheeler variable. Read the same heading across the run sequence to see how our understanding of that variable evolved.
green time pair range
The batch’s two widest in-run pair-ranges — |green_a − green_b| from a single metrics row — were 75s (b9d893a) and 64s (8383ee6), both under the run’s range UCL of 125.6s. Both halves of each pair produced the same files and passed, so the divergence is never in the code: pair 1 was equivalent work (13 vs 12 Reads, 4 vs 4 Edits, 2 vs 2 mvn cycles) and pair 2 split only on exploration style — _a found the insertion point by Glob, _b hunted for it with 24 Greps vs 9, sixteen more tool calls reaching the same point. In both pairs the leaner, fewer-token half won and was brought back; pair 2’s extra grepping stayed inside the project tree (the #415 fix holding, no ~/.m2 jar-hunt). Both resolve to common cause — rate jitter for pair 1, equally-valid exploration luck for pair 2 — with no assignable, beyond-threshold pair in the batch’s worst two.
green time pair range moving range
No finding this run.
green time
The longest scenario this run was “Test suite name should start with a capital letter validation” at 6:27 (winning half) / 7:31 (losing half). The slowest scenarios were slow because of how the time decoded, not because either half was driven down a longer path; neither pair is a net-new-logic case (both are validation-rule wirings), consistent with both landing within the token-similarity threshold.
green time moving range
No finding this run.
scale & green tokens
Wall-clock fuses real work (tracked by output tokens) with the per-token generation rate, and the token-scaled pair-range gate splits them: within the 15% token-similarity threshold the slower half is scaled to the faster half’s per-token rate, leaving a scaled (work-attributable) range and a rate-overhead remainder. Pair 1 (0.3% token diff, 6,925 vs 6,905 output tokens) scales to a 1s range with 74s of rate overhead — pure jitter. Pair 2 (7.8% token diff, 11,984 vs 13,001 tokens) scales to 33s with 31s overhead — roughly half the gap is real work volume. Ranking the same 12 scenarios by token divergence instead of wall-clock range surfaces a different top two (7476bbb at 15.6%, 1dd042e at 18.4%) that are near-invisible on the range chart — fast decode absorbed materially different work, so the range never registered it. The methodological takeaway: wall-clock pair-range and token pair-difference are orthogonal reproducibility axes; screen on both, since a fast-decode day can mask a real work divergence in the time range.
warm-up position
No finding this run.
Open Questions From This Case
- Pair 2’s “Grep-heavy vs Glob-direct” — is there a prompt nudge that is not tampering? A hint to prefer
Globfor known class names over name-guessingGrepchains would target the 33s work-volume slice. But it acts on common-cause variation, so it belongs as a distributional experiment (like--effort), measured on the band, not justified by this one pair. - Does the same-scenario-across-batches comparison generalize? Pair 2 gave a clean before/after on one scenario (7576 assignable → 84 common). Tracking a fixed scenario’s pair-range across batches, rather than within one batch, may be a sharper regression detector than the per-batch top-2.